Trend Insights
Visualize an Assessment using Trend Insights
Whatfix enables you to track how your learners perform in Assessments using Trend Insights. You can also view Assessment performance in Assessment Analytics on the Mirror Analytics Dashboard. For more information, see Create an Assessment and Assessment Analytics.
For example, you can track how many learners passed or attempted a compliance Assessment over a specific time period to identify drop-off patterns across your learners.
Whatfix provides the following events to track assessment performance:
- Assessment Attempted: Tracks when a learner attempts an Assessment. For example, this event records when a learner accesses the landing Screen of an Assessment that contains five Workflows.
- Assessment Passed: Tracks when a learner passes an Assessment by meeting its required Pass criteria. For example, this event records when a learner completes at least three of the five Workflows in an Assessment that has a Pass criteria of three Workflows.
Use the following steps to visualize an Assessment using Trend Insights:
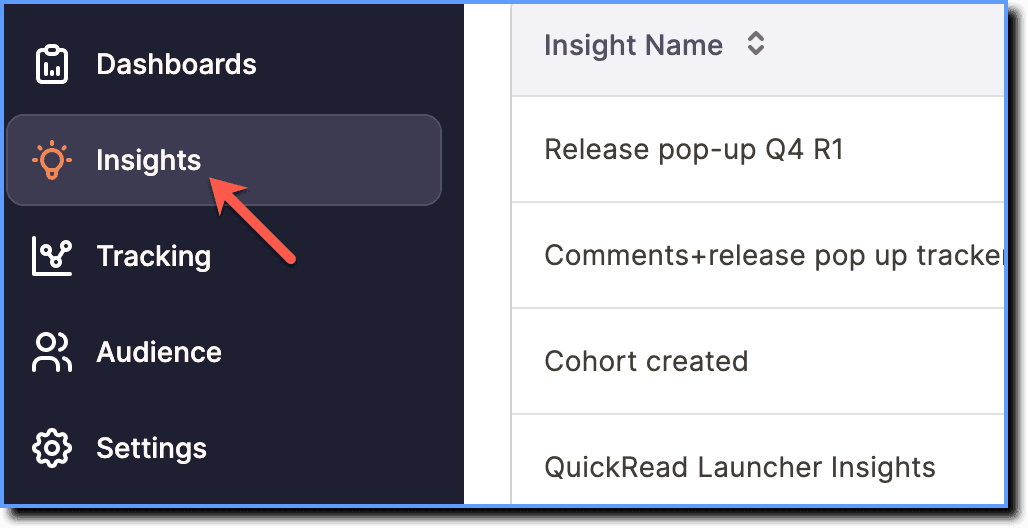
- On the Whatfix Analytics Dashboard, click Insights.
 2. Click Create insights.
 3. Click Trend Insights.
 4. Click the Give your insight a name text box to enter a name for your Insight.
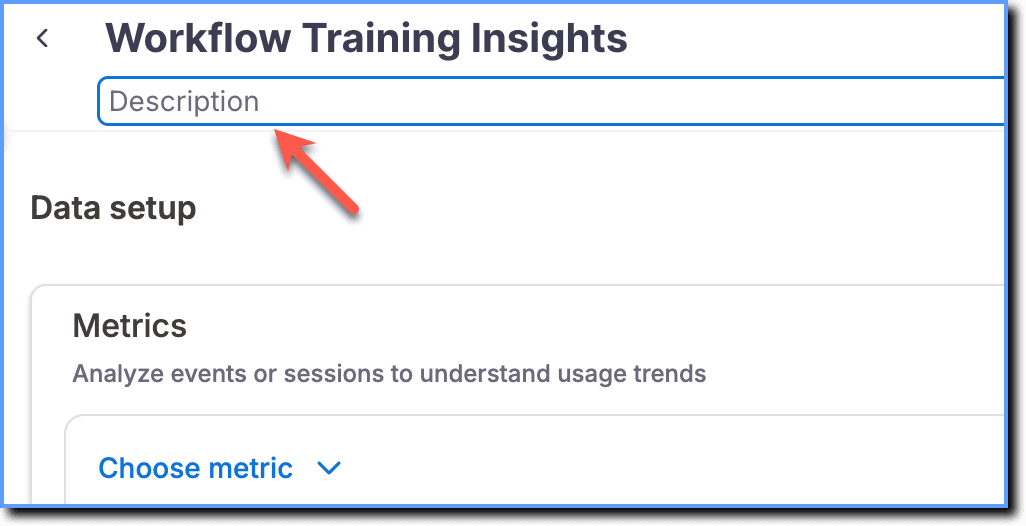
 5. Click the Description text box and enter a description that explains what the Trend Insight is about.
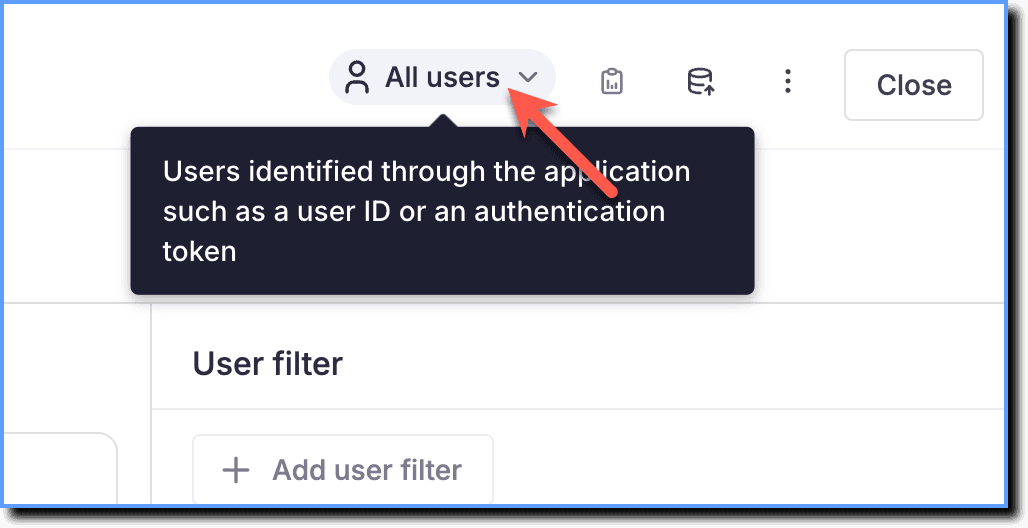
 6. Click All Users.
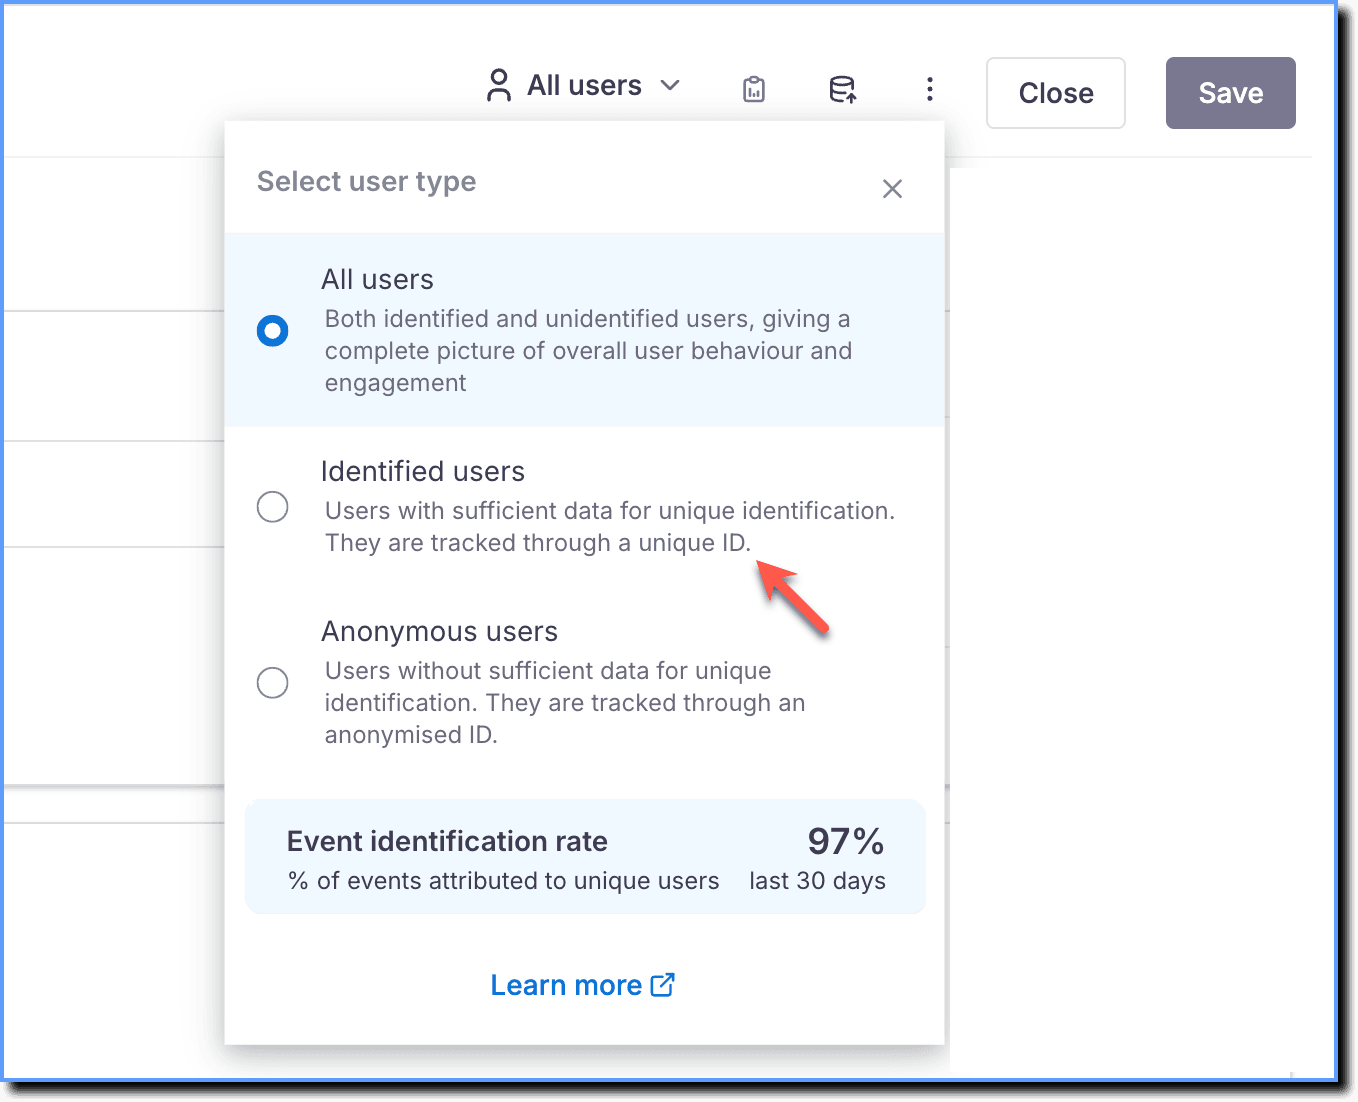
 7. From the Select user type dropdown, choose whether to analyze data for All users, Identified users, or Anonymous users.
 8. Click Choose metric.
 9. Under Event metrics, select Total events or Unique users as required.
 10. Click Add event.
 11. Click Mirror events.
 12. Select Assessment Attempted, Assessment Passed, or both to track Assessment performance.
 13. Click Apply.
 14. Select the required Filter or Breakdown. For more information, see Filter events using Event Filters and Breakdown in Trend Insights.
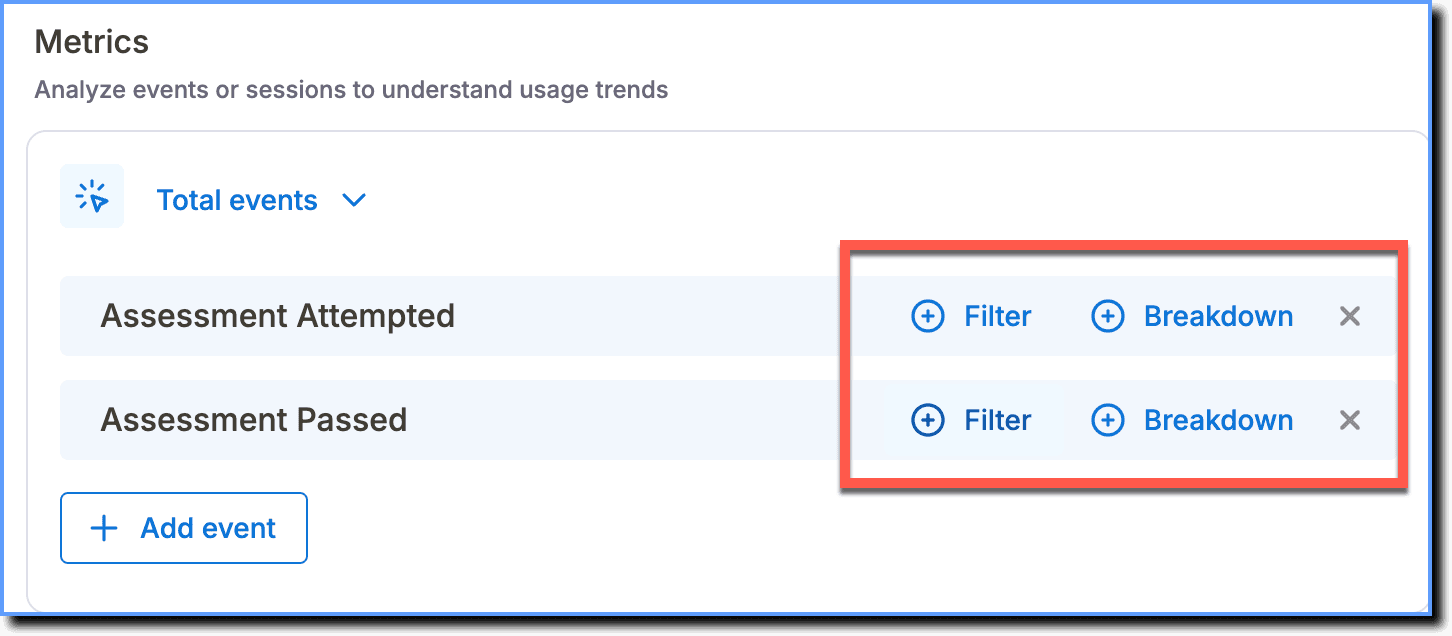
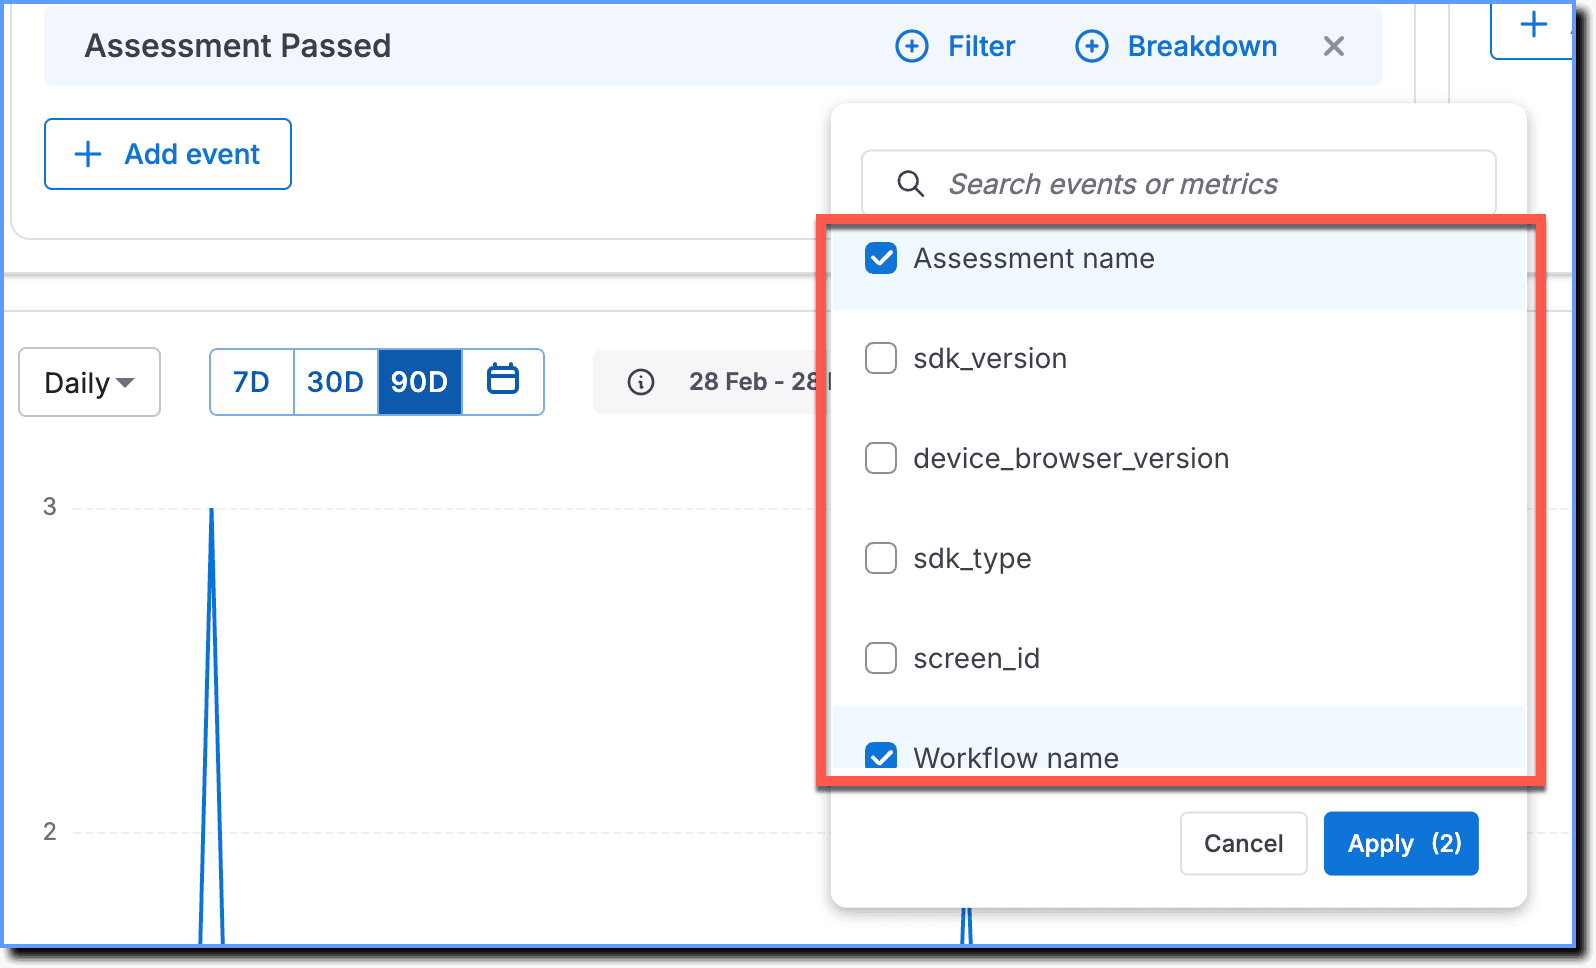
You can filter or break down Assessment performance in the following ways:
- Assessment name: View data for a specific Assessment.
- Workflow name: View data for a specific Workflow.
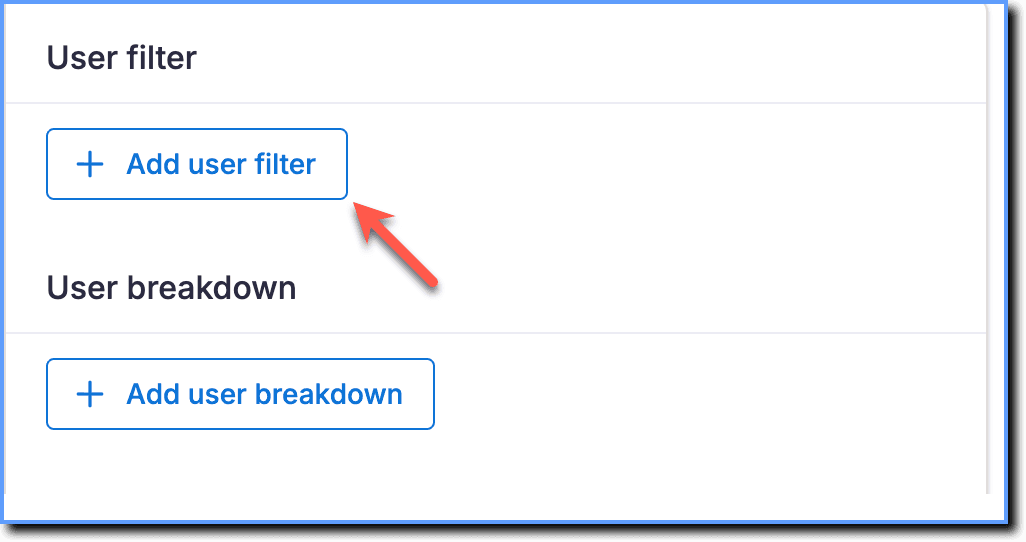
- Click Add user filter and select the required user filter. For more information, see Filter Insights data using User Filters and User Breakdown.
- To exclude specific filter values from your data, you can apply the required filters. For more information, see How can I exclude filter values while analyzing events?
- To exclude blank filter values from your data, you can exclude them from your user filters. For more information, see How can I exclude blank filter values in Insights?
- Click Add user breakdown and select the required user breakdown. For more information, see Filter Insights data using User Filters and User Breakdown.
 3. Once the setup is complete, scroll down to view the generated data chart.
 4. Click Save.
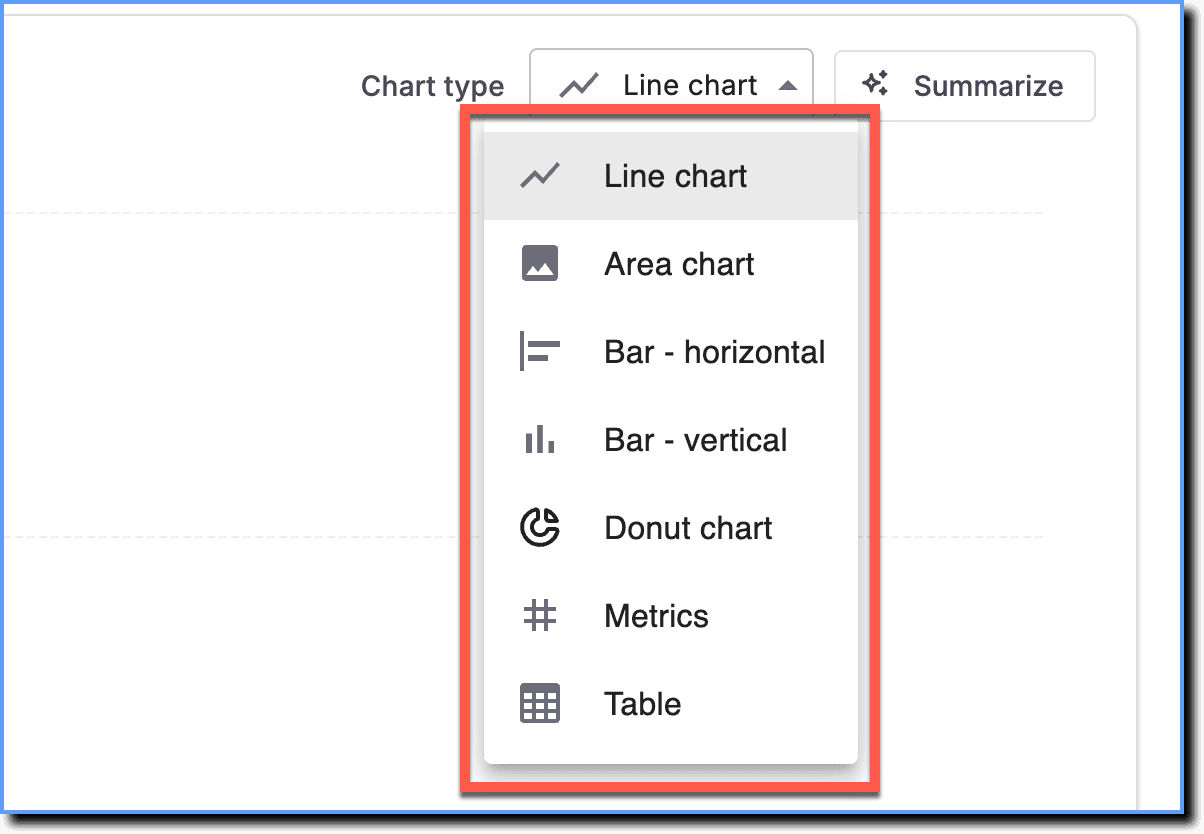
- Select the required chart type to visualize the data for your insight. For more information, see Understand the chart types in Trend Insights.
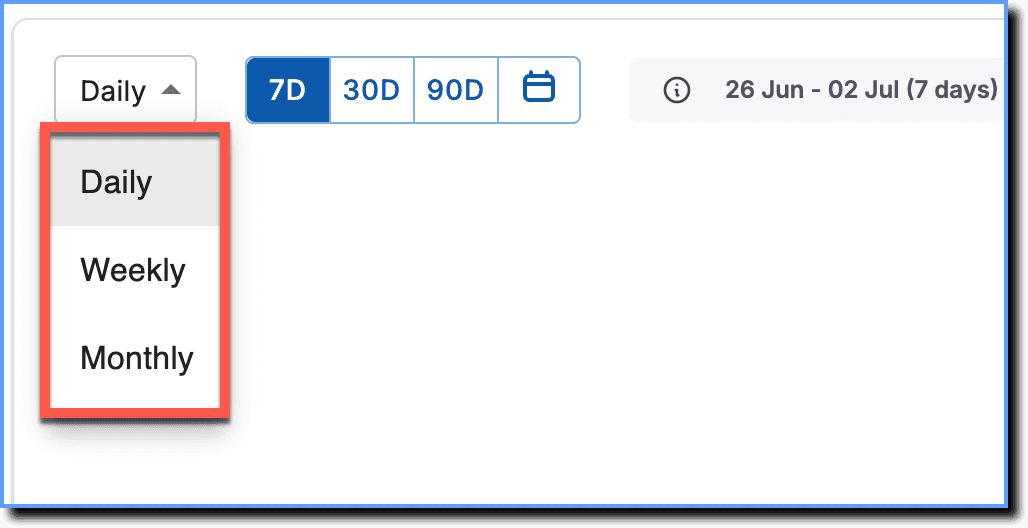
- Filter data based on Daily, Weekly, and Monthly timeframes.
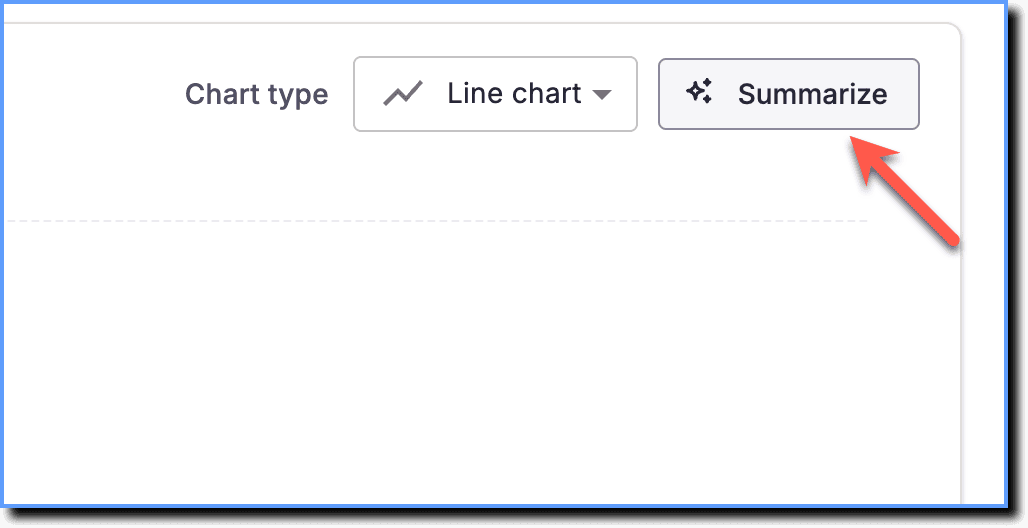
- Click Summarize to generate an AI summary of the Trend Insight. This helps you interpret the data more easily and understand key patterns. You need to enable Ask Whatfix AI to get the AI summary. For more information, see Introduction to Ask Whatfix AI.
An interactive evaluation created by using existing Simulations to measure how proficiently end users complete tasks without assistance.
Trend Insights turns your engagement-related queries, such as the number of users who have completed Flows or the number of users who have clicked the button on your Pop-up, into actionable insights.
Defines how many Workflows a user must complete to pass an Assessment. Based on your requirement, you can set it to include all Workflows or a specific number needed to demonstrate proficiency.
Shows overall behavior and engagement for both identified and anonymous (unidentified) users.
Users that Whatfix can detect and identify using a unique User ID.
Users that Whatfix cannot identify. These users are denoted by the Anonymized Whatfix IDs rather than an actual User ID.
The total number of times the event occurred.
The number of unique users who triggered the event.