Trend Insights
Understand the chart types in Trend Insights
After creating a Trend Insight, view all usage and engagement-related data for your Whatfix content in easy-to-understand visual formats.
Info:
Expand the accordion(s) for more details.
Chart View
The chart view also enables you to view your Trends data using the following chart types:
| Chart type | Definition |
|---|---|
| Line chart | A graphical representation of data points connected by lines, showing trends or patterns over time, such as the number of clicks on a Pop-up CTA. 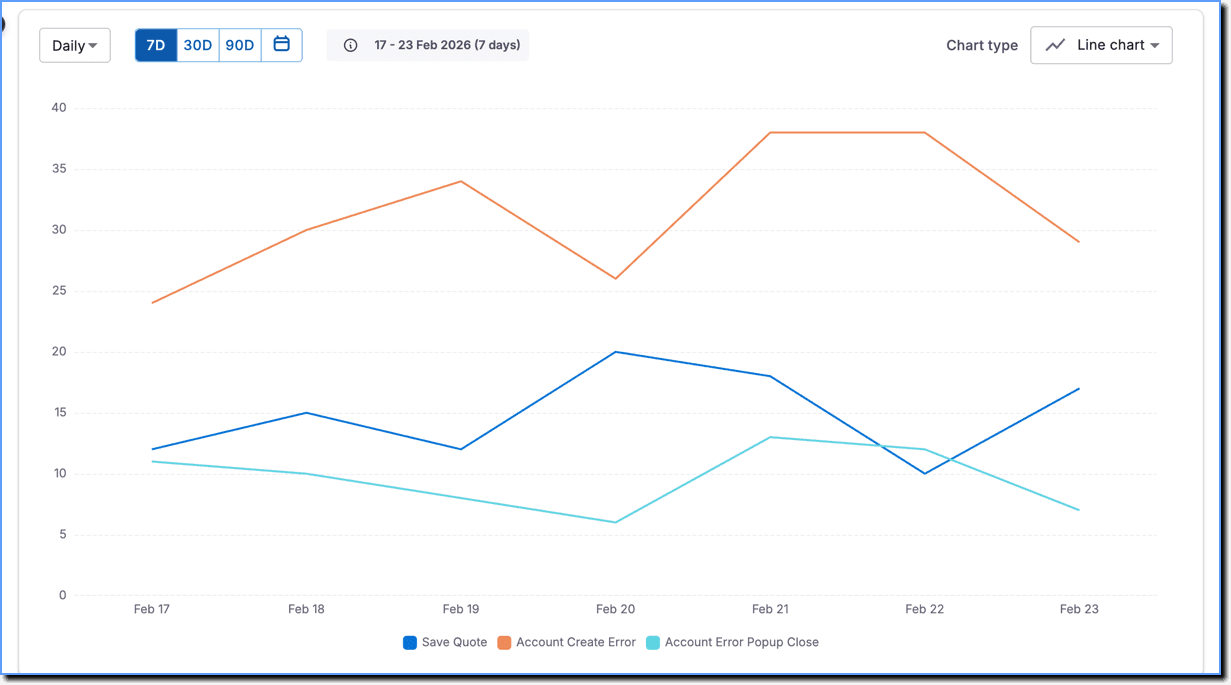 |
| Area chart | A chart that displays data as a series of data points connected by lines and filled with colors, showing changes in the magnitude of data across different categories over time, such as the total number of impressions of different widgets over a year. 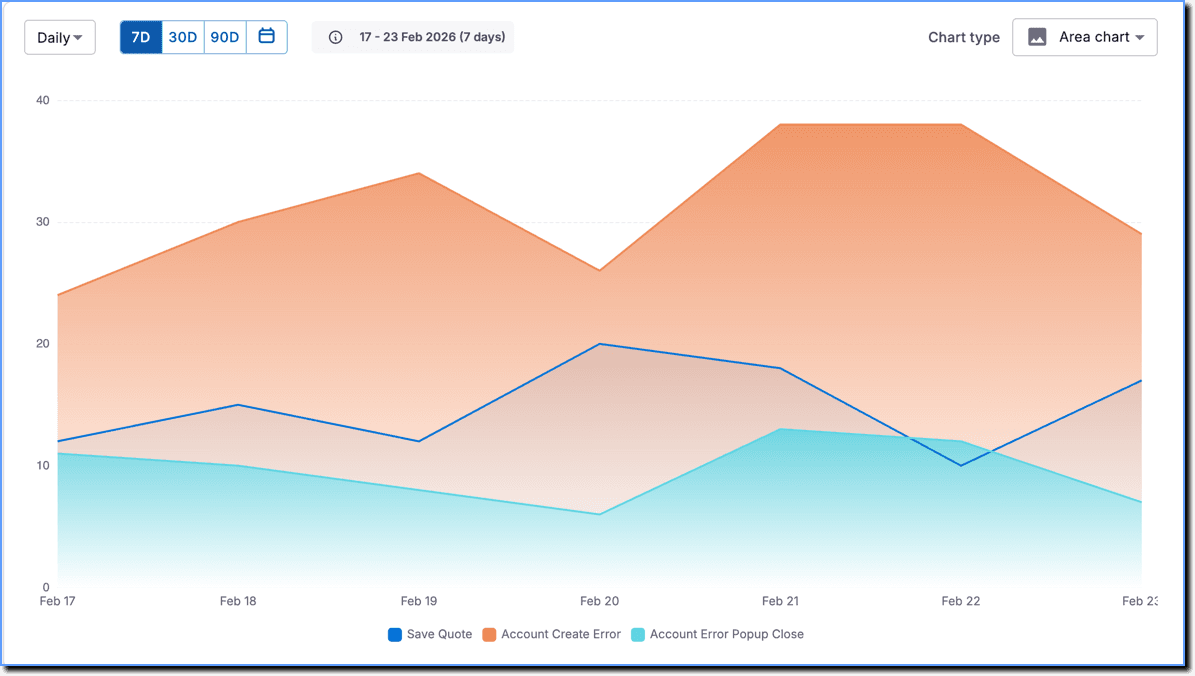 |
| Bar - Horizontal | A chart that uses horizontal bars to represent data, comparing different categories, such as which content has seen the most interaction. 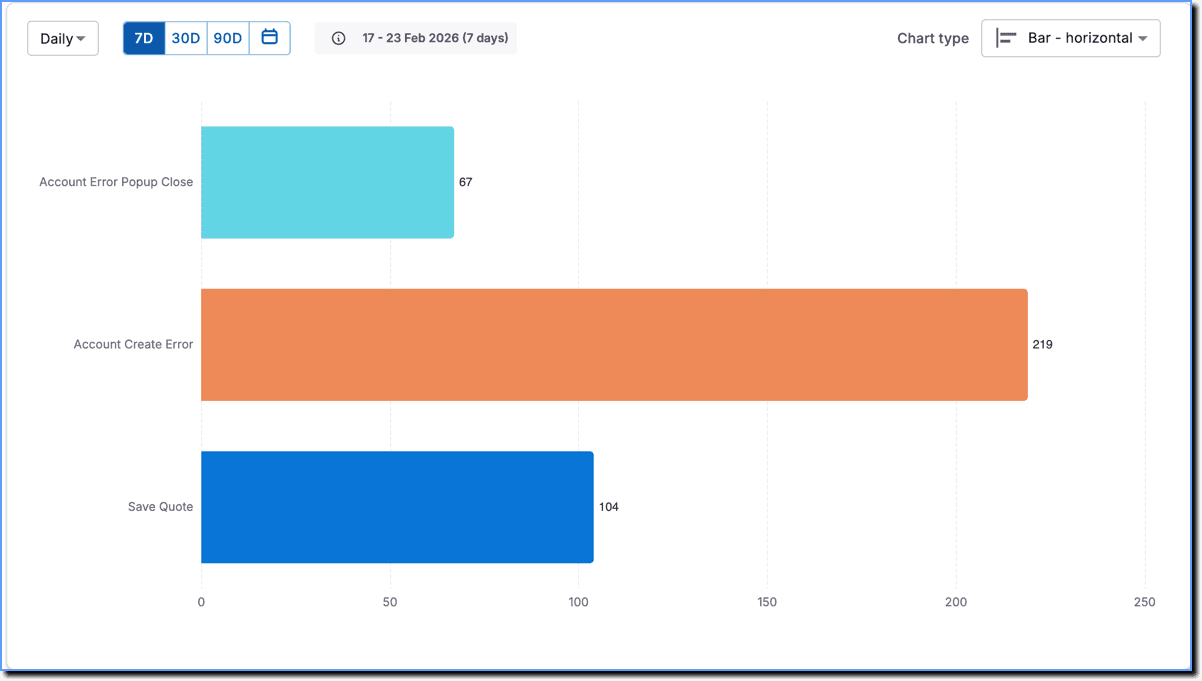 |
| Bar - Vertical | A chart that uses vertical bars to represent data, comparing different categories, such as which content has seen the most interaction. 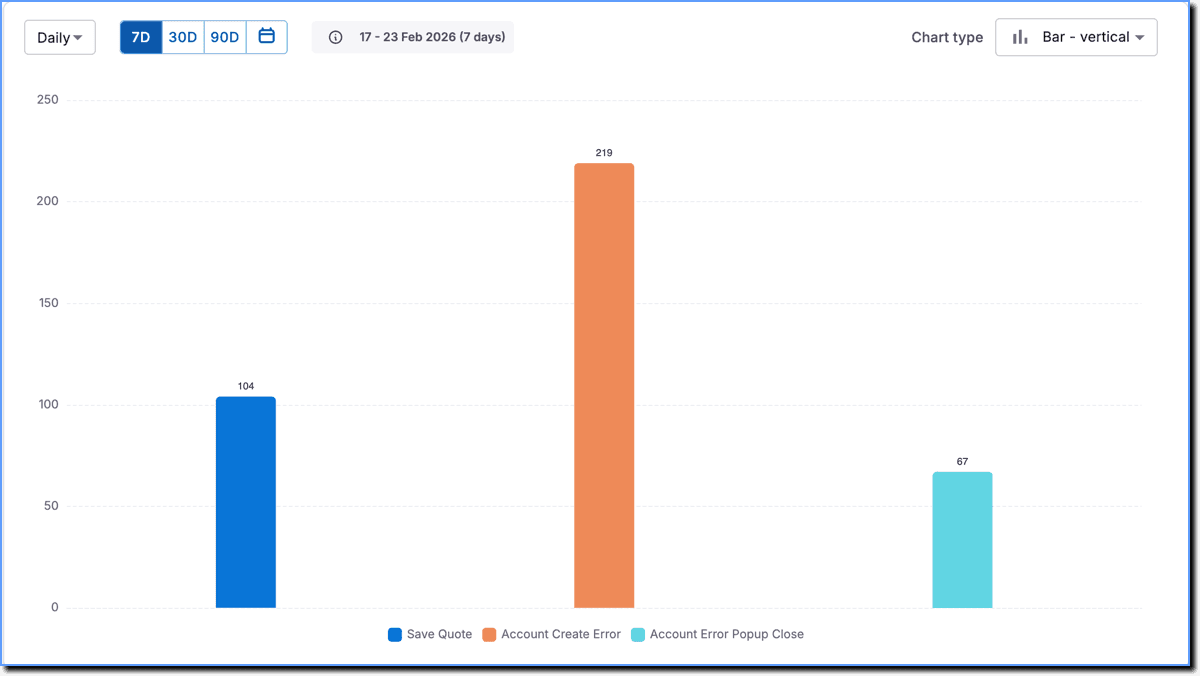 |
| Donut chart | A donut chart is a type of pie chart with the center removed to create a hollow look. Data is distributed into segments, where each segment represents a portion of the whole, and the entire donut represents the total sum of all data. The hole in the middle displays metrics, such as Total events or Unique users, based on the selection for all segments. Click a segment to expand it and view metrics for that segment. 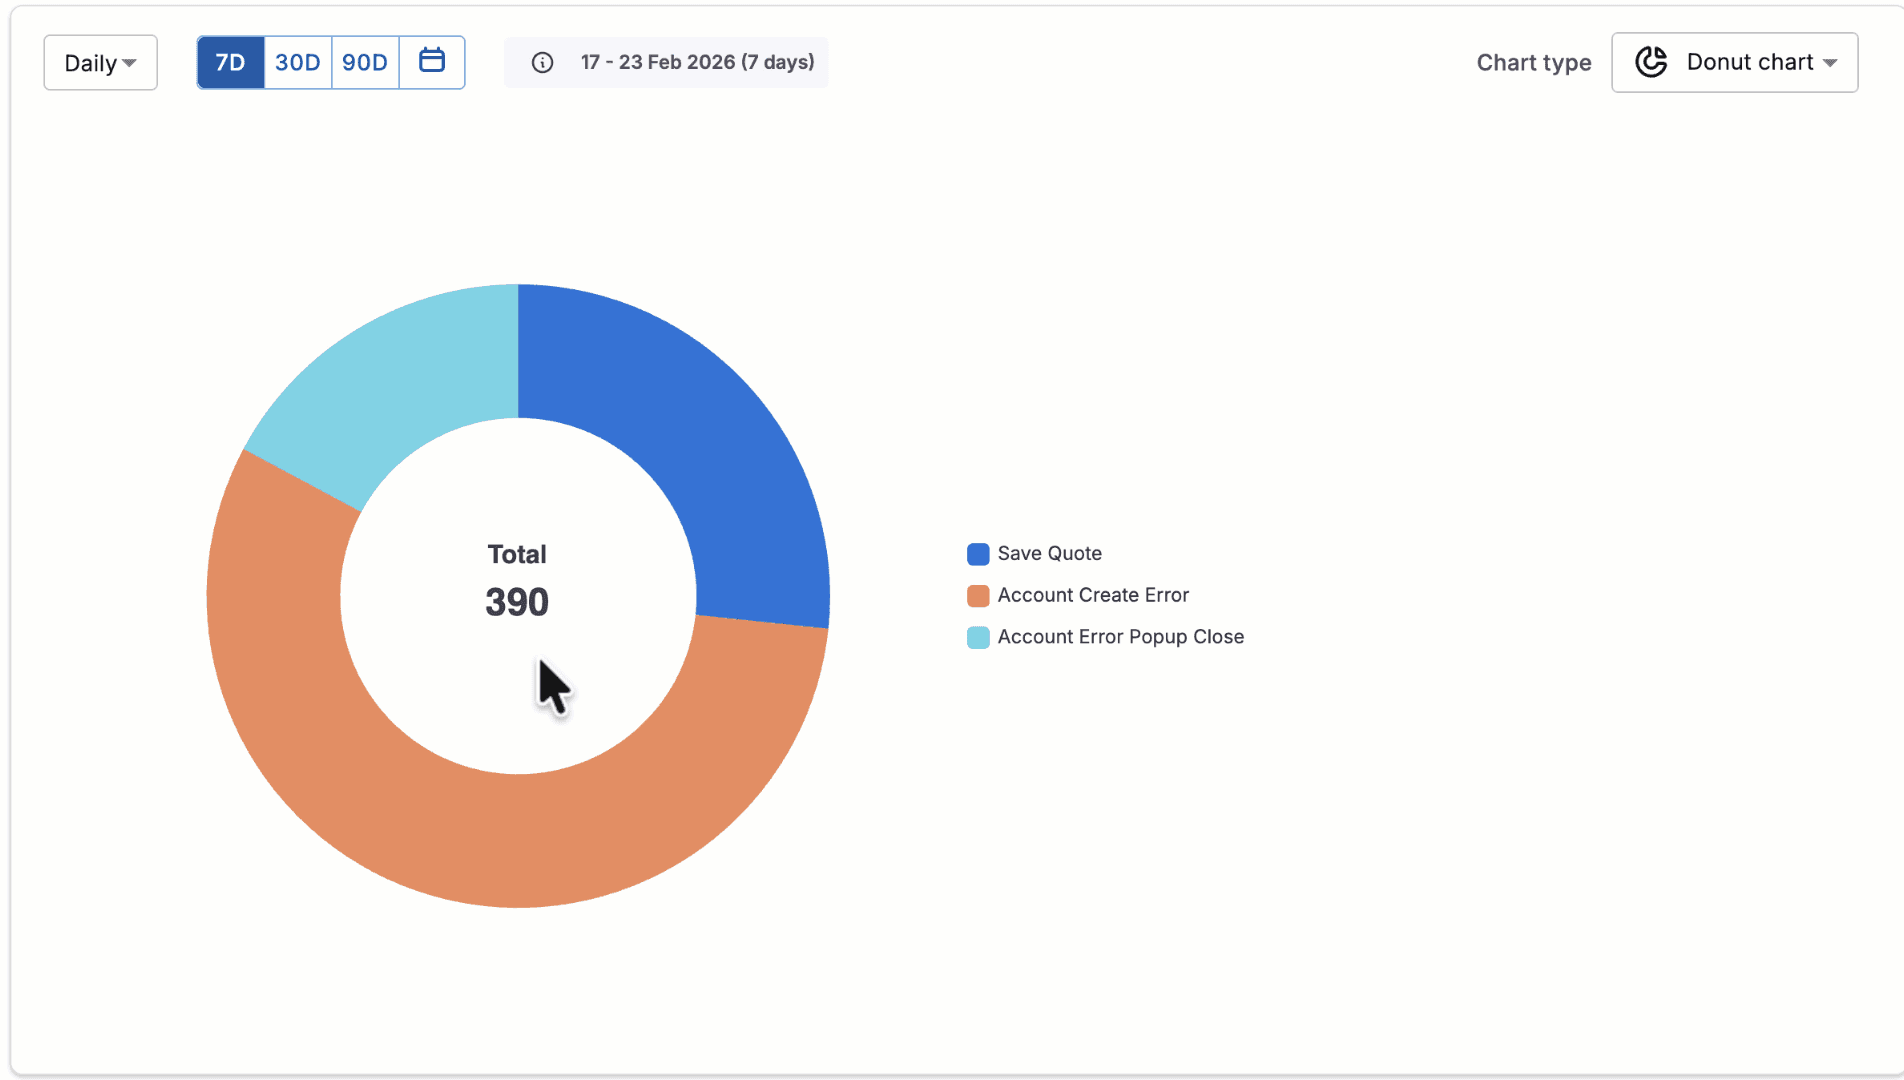 |
| Metrics | A visual representation of key performance indicators (KPIs) or metrics, tracking performance or progress towards a specific goal, such as displaying the conversion rate on a dashboard. 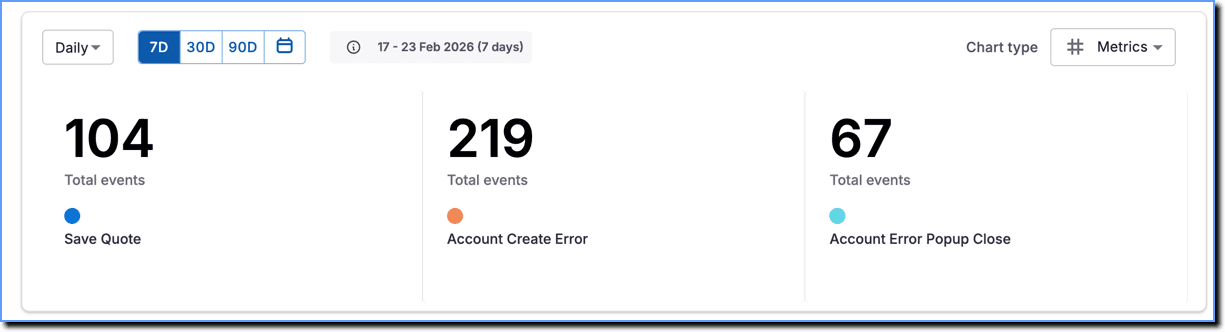 |
Filter Trends data using default and custom date filters or based on Daily, Weekly, and Monthly timeframes. 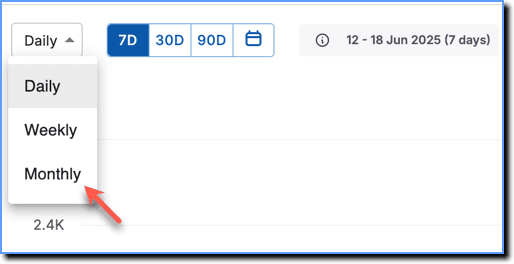
Table View
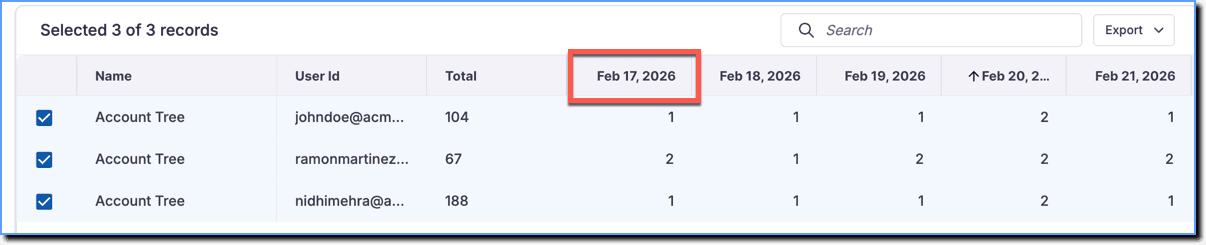
The Table view displays selected events, the total number of events or unique users (based on the chosen metric) who engaged with the events, any user or event breakdowns, and engagement for the selected time period.
Note:
The date format in the table view is set to Month Date, Year and cannot be changed.
To download Trend Insights data, see Download Trend Insights.
The total number of times the event occurred.
The number of unique users who triggered the event.