Guidance Analytics dashboard experience
Metrics on the Task list Analytics Dashboard
The Task List Analytics Dashboard helps you measure and understand how end users engage with your Task Lists. For example, to see the number of users who completed a Task List.
Use the Task List Analytics dashboard to analyze the engagement metrics for a selected Task List**.**
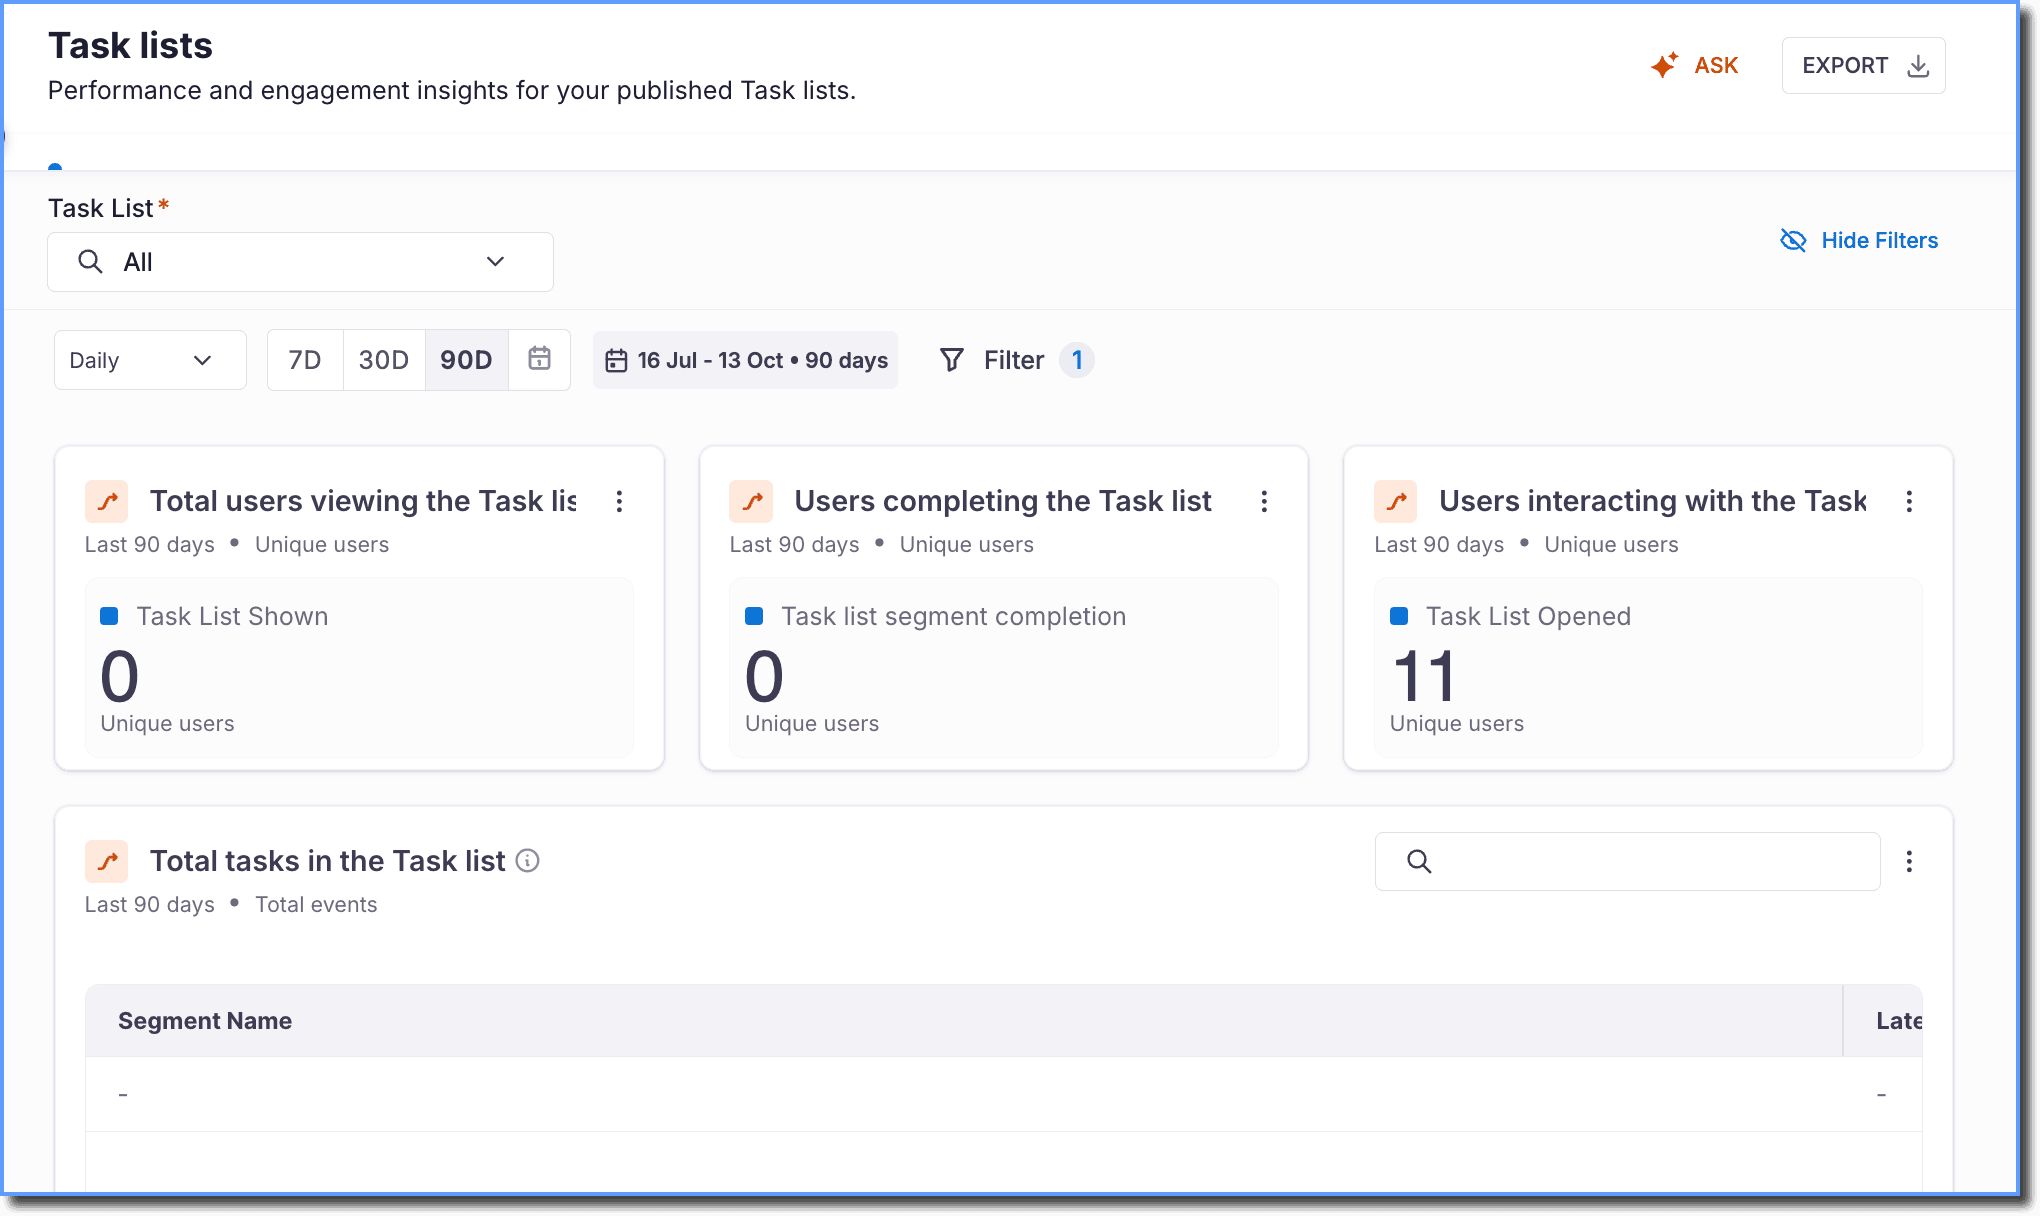
Expand the following accordions for more details:
Summary of overall end user engagement for a Task List
Use the dashboard to analyze the user performance for a selected Task list. It includes metrics such as the number of times end users completed all the tasks in the Task list, number of tasks completed per end user, and more.
To analyze the metrics displayed on the dashboard, select a Task List Segment from the Task List filter.
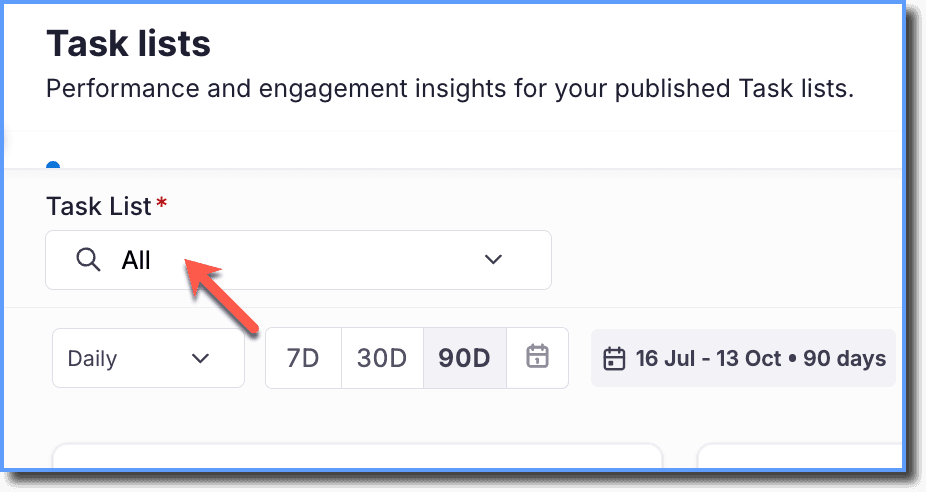
The following table shows the metrics displayed on the Task List Analytics dashboard:
| Metric | Description | Event or Event Group | Events Included |
|---|---|---|---|
Total users viewing the Task list 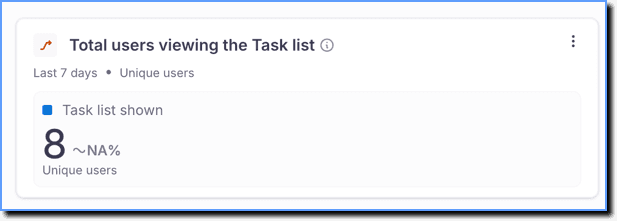 | Displays the number of unique end users who viewed the Task list. | Task list shown | — |
Users completing Task list 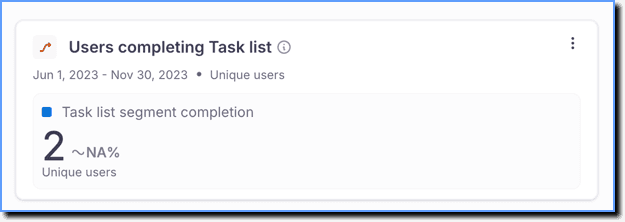 | Displays the number of unique end users who completed the Task list segment. | Task list segment completion | — |
Total task in the Task list 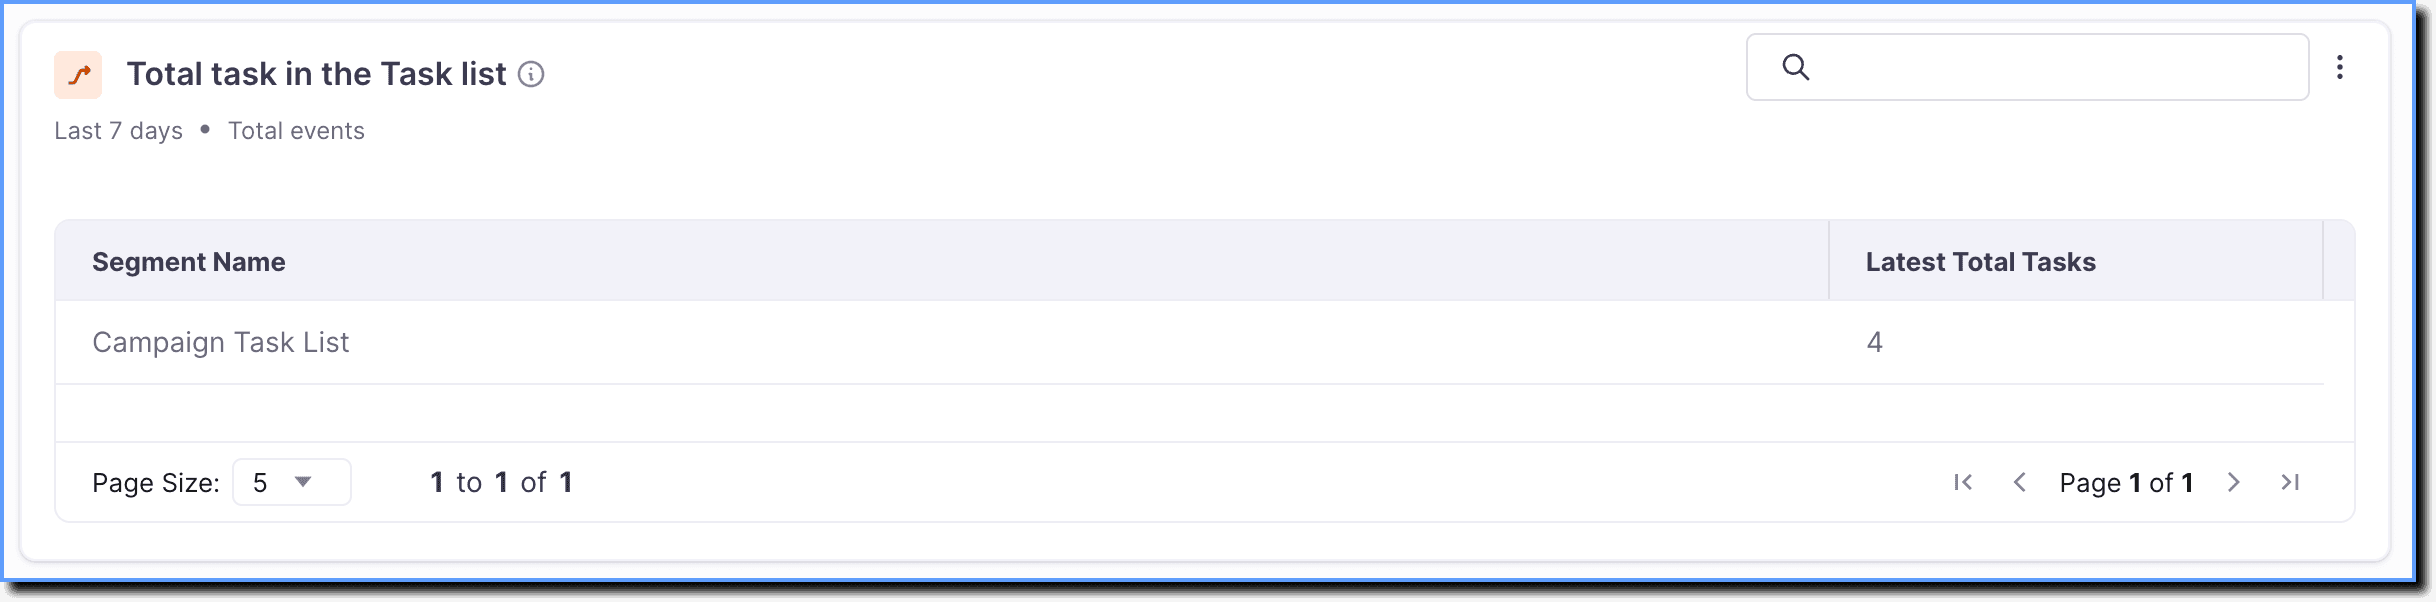 | Displays the total number of tasks available in the Task list selected using the dashboard filter. | Task list shown | — |
Task list task completed by unique users 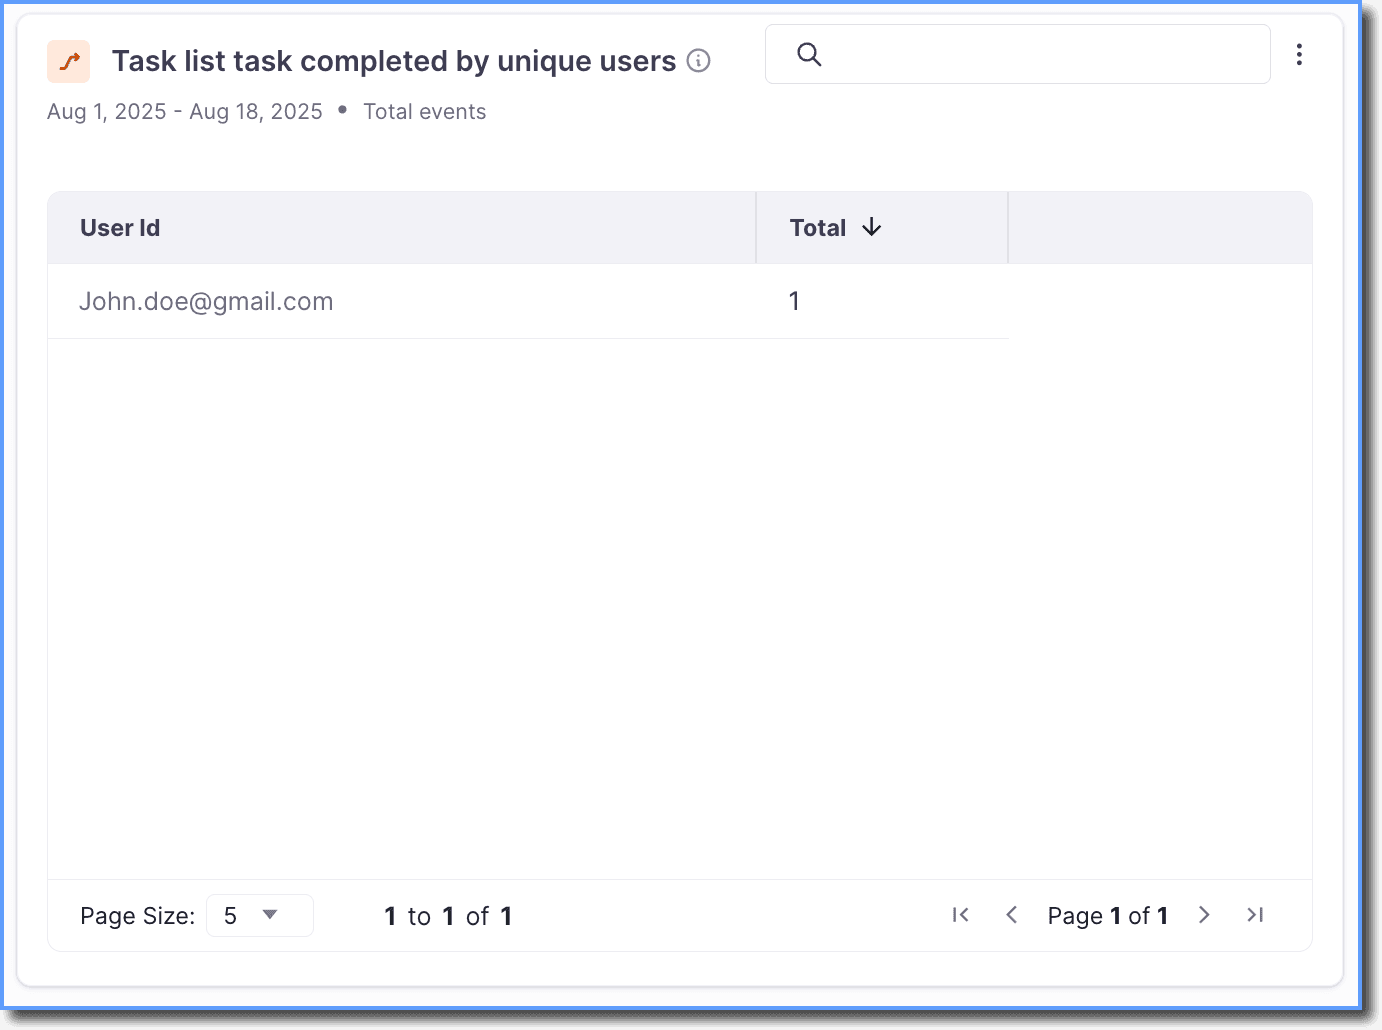 | Displays the total number of tasks that end users completed in the selected Task list. | Task List Task Completion Events | - Flow completed - Flow slideshow completed - Article viewed - Pdf Viewed - Link opened in new format - Video link clicked - IMAGE_START |
Task completion 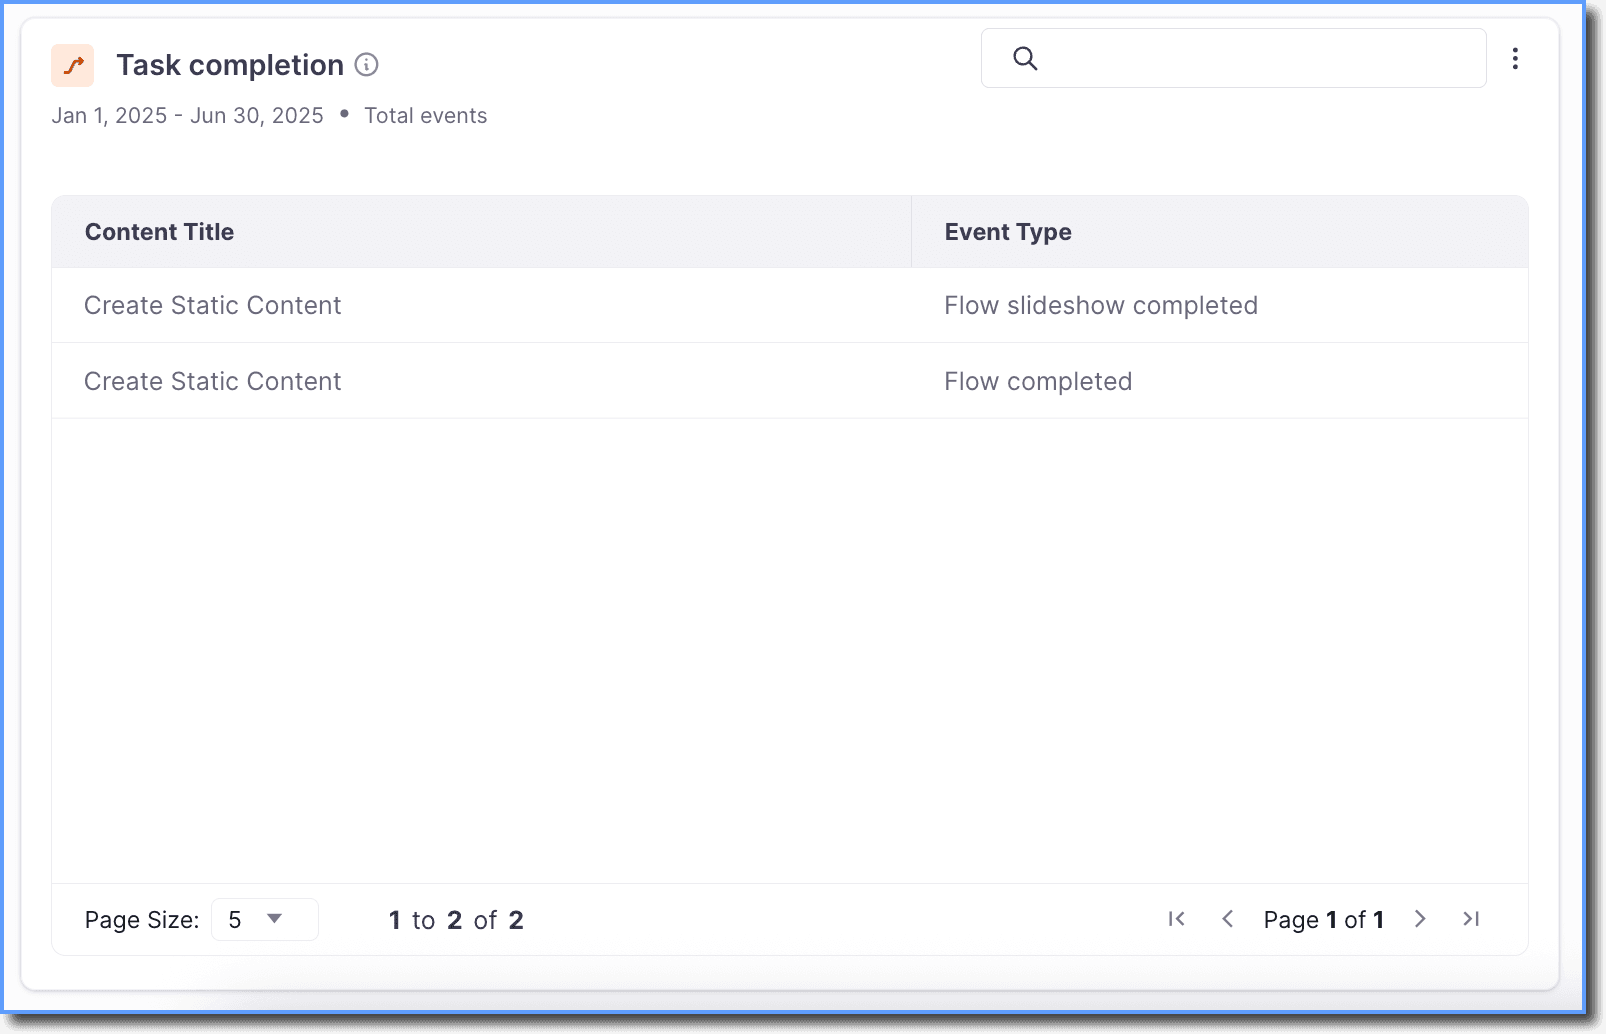 | Displays all tasks completed across users in the selected Task list. Apply user filters to view task completion for specific users. | Task List Task Completion Events | - Flow completed - Flow slideshow completed - Article viewed - Pdf Viewed - Link opened in new format - Video link clicked - IMAGE_START |
Users interacting with the Task list 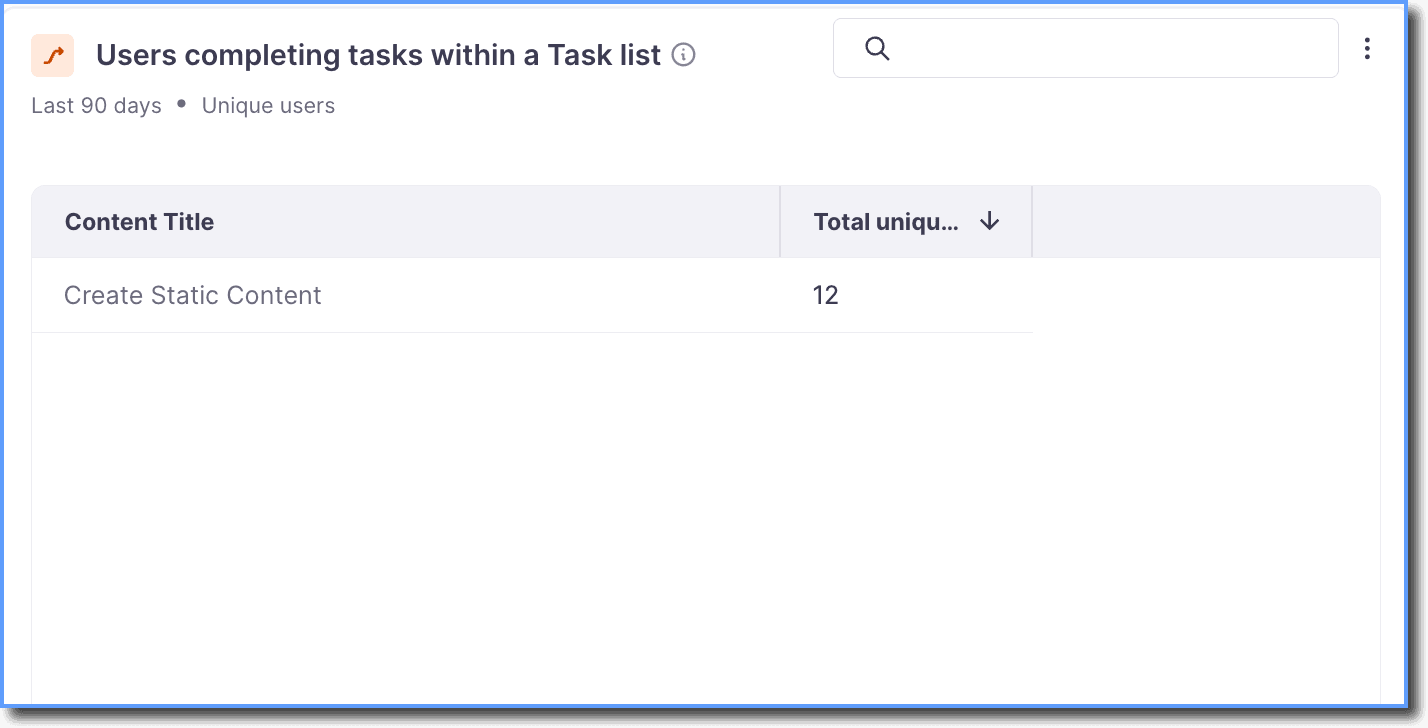 | Displays the number of unique users who complete a particular task in the Task list. | Task List Task Completion Events | - Flow completed - Flow slideshow completed - Article viewed - Pdf Viewed - Link opened in new format - Video link clicked - IMAGE_START |
Use Event Filters or User Filters to narrow down the Task List metrics. For more information, see the Filters section.
Filters: To further narrow down the user and task level engagement for a Task List
Whatfix provides two options to further filter the Task List metrics on the dashboard,:
- Dashboard level filters: Apply Filters for all metrics displayed on the Guidance Analytics dashboard. For example, to view all the Task List metrics in the dashboard for only desktop users, click Filter → Device → Device Type → desktop. For more information, see Use Filters in Dashboards.

- Insight level filters: Apply Event Filters and User Filters for individual metrics displayed on the Guidance Analytics Dashboard. For example, to analyze the Total users viewing the Task List in the dashboard for only desktop users, click User Filter → Device Type → desktop.
Event Filters:
Use Event Filters to narrow down events based on event properties such as Segment Name, Content Title, Event Type, and more. For example, to view the number of users who completed Flows within a Task list segment, click Filter → Event Filters → Task List Completion Events → Event Type → Flow completed.
For more information, see the Task List section in Event Filters and Breakdown in Trend Insights.
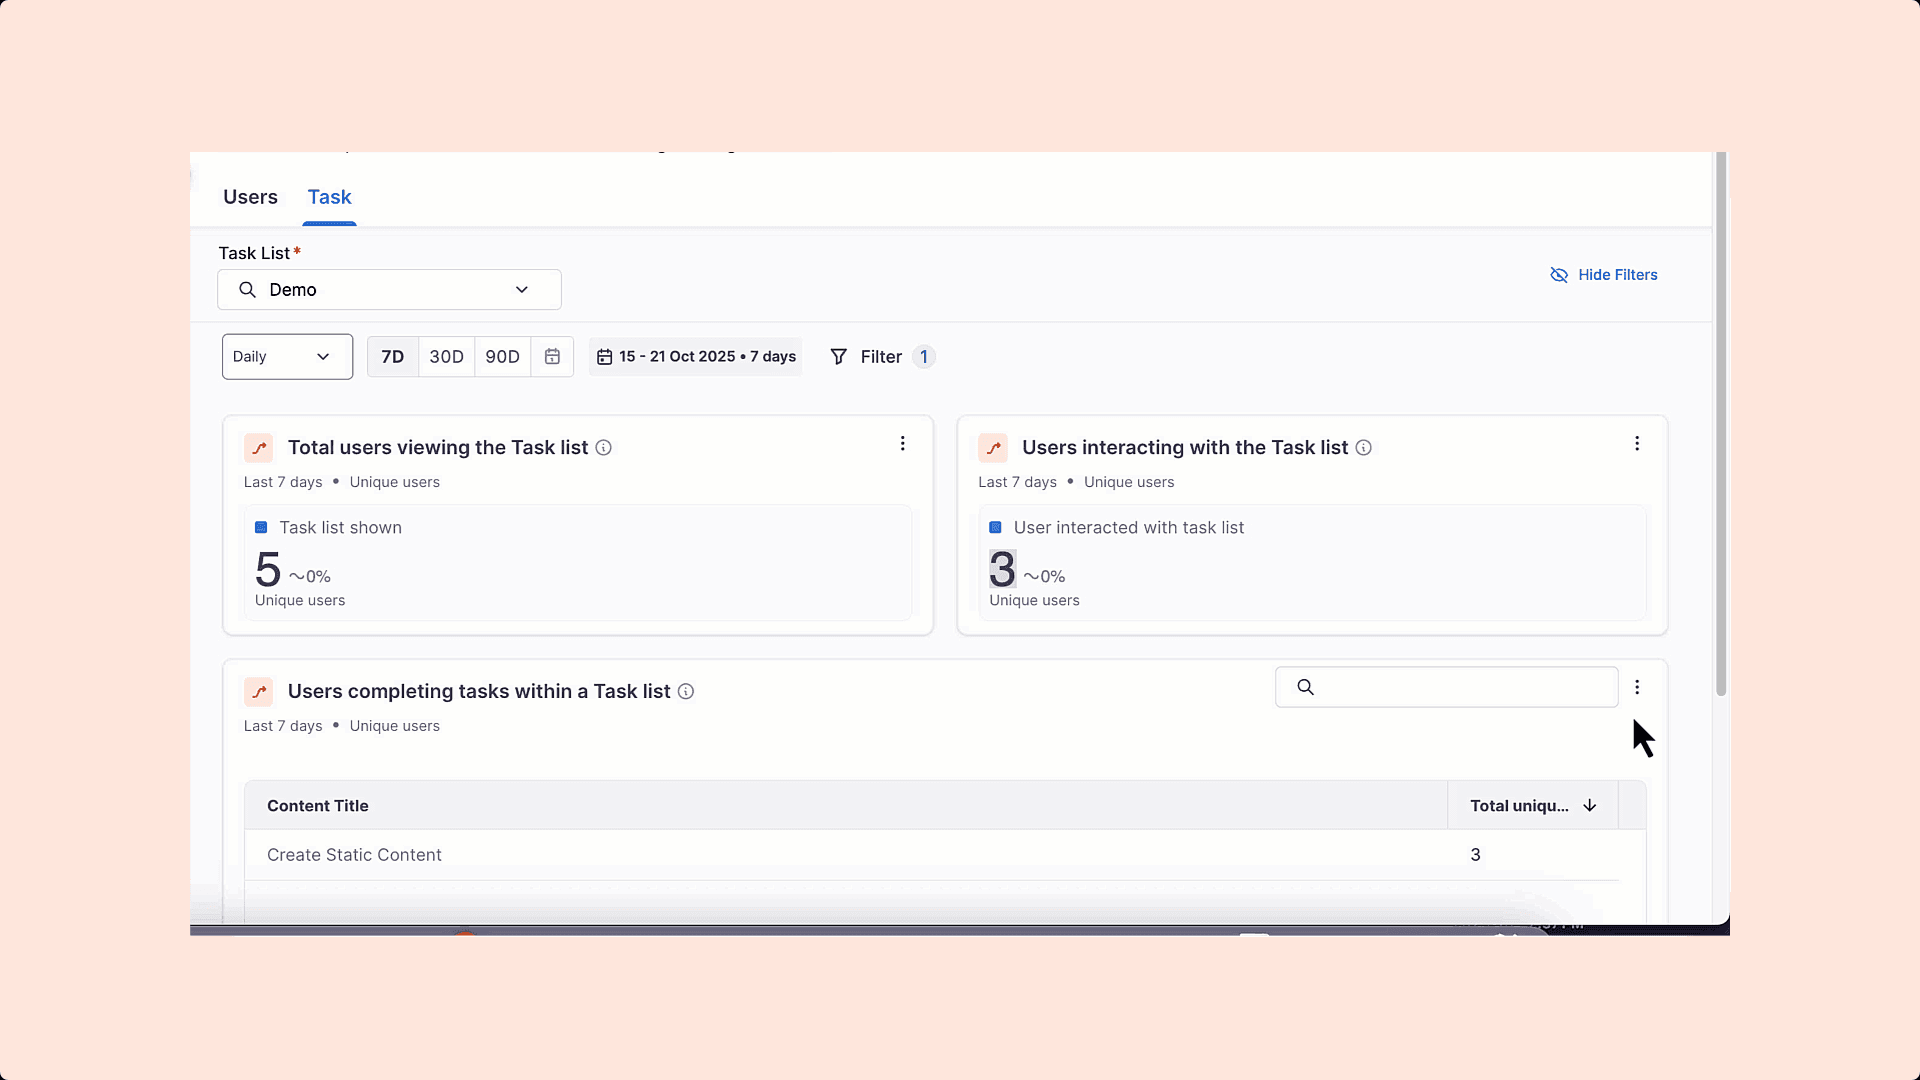
Use the following table to understand the Event Filters applicable for each metric on the dashboard:
| Metric | Event or Event Group | Events Included | Event Filters |
|---|---|---|---|
| - Total users viewing the Task list - Total Task in the Task List | Task list shown | — | - Task List - Latest Total Tasks |
| - Users completing Task list | Task list segment completion | — | — |
| - Task list task completed by unique users - Task completion | Task List Task Completion Events | - Flow completed - Flow slideshow completed - Article viewed - Pdf Viewed - Link opened in new format - Video link clicked - IMAGE_START | - Task List - Event Type |
| - Users interacting with the Task list | Users interacted with task list | — | - Task List |
User Filters:
Use User Filters to narrow down the data shown by applying conditions based on user-specific properties such as browser, operating system, city, or country. For example, to see the number of users on desktop devices who have completed a Task list, click Filter → User Filters → Device Type → desktop.
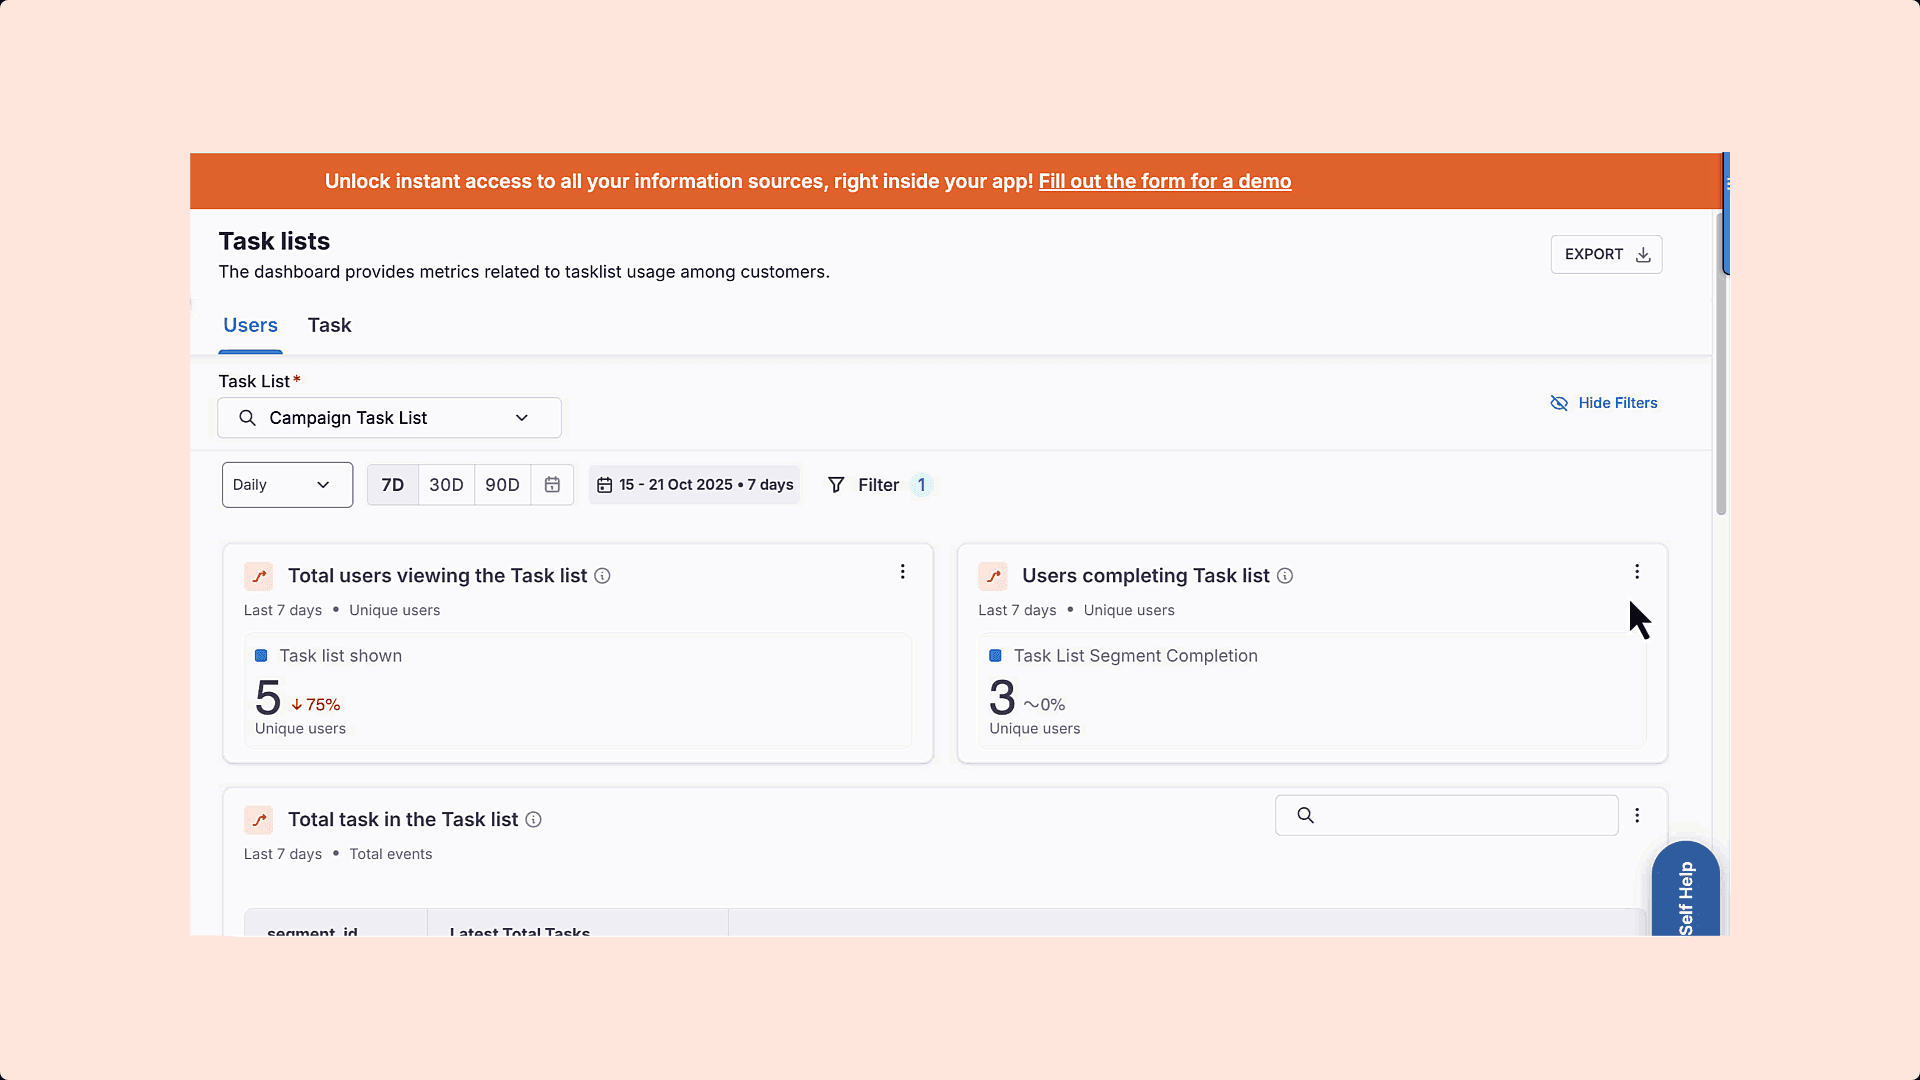
Apply the following User Filters to further narrow down the engagement metrics in the Users and Task dashboards:
- Device
- Location
- URL/IP
- User
- Variables
- Uncategorized
For more information, see Filter Insights data using User Filters and User Breakdown.
- By default, only data from the Production stage is shown. If you want to get data from other stages, you need to configure them on your Whatfix Guidance Dashboard. For more information, see Get Analytics Data across CLM Stages.
- Once you’ve configured the stages in Settings, see How do I get analytics data across CLM stages in the New Guidance Analytics Dashboard experience? to know how to get the data across stages in the new experience.
The Task List is a widget that gives you the ability to assign a list of topics/tasks users must complete as part of a training program.