Guidance Analytics dashboard experience
Metrics on the Self Help Analytics Dashboard
The Self Help Analytics Dashboard has the following five tabs:
The Dashboard includes analytics for both the Old and New Self Help experiences. To access the Self Help Analytics, see Self Help Analytics - New Guidance Dashboard.
- Overview
- Successful and unsuccessful search terms
- QuickRead
- Feedback
- Old vs New Self Help
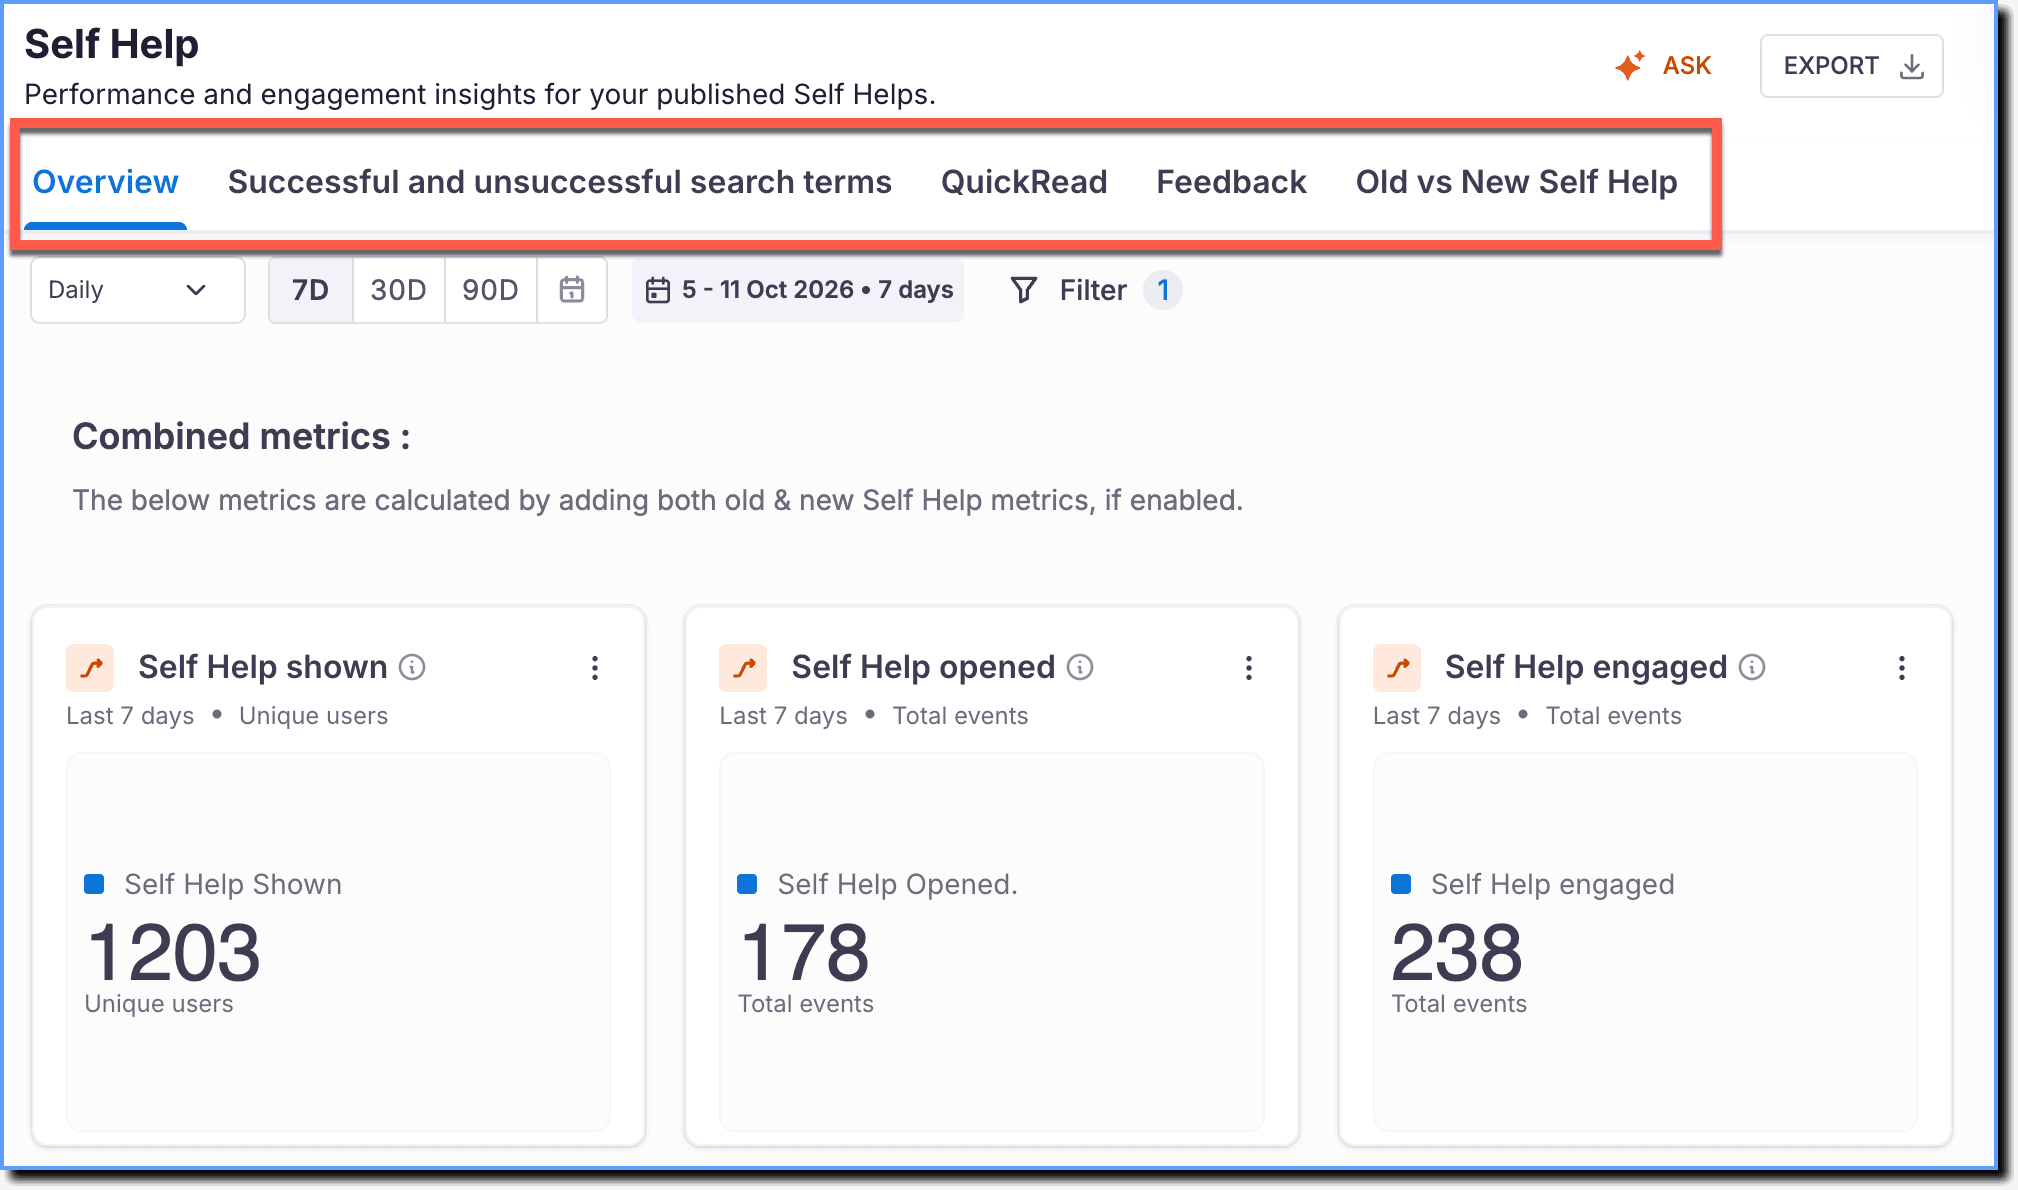
Expand the following accordions to know more about each Dashboard.
Overview
The Overview dashboard shows the overall end-user engagement with Self Help. It includes metrics such as the number of times end users opened Self Help, the number of Self Help queries served on a daily basis, the number of times end users accessed content from Self Help, and more.
The following table shows the metrics available on the Overview Dashboard:
| Metric | Description | Event Group | Events Included | Event Filters | User Filters |
|---|---|---|---|---|---|
| Combined Metrics: | |||||
Self Help shown 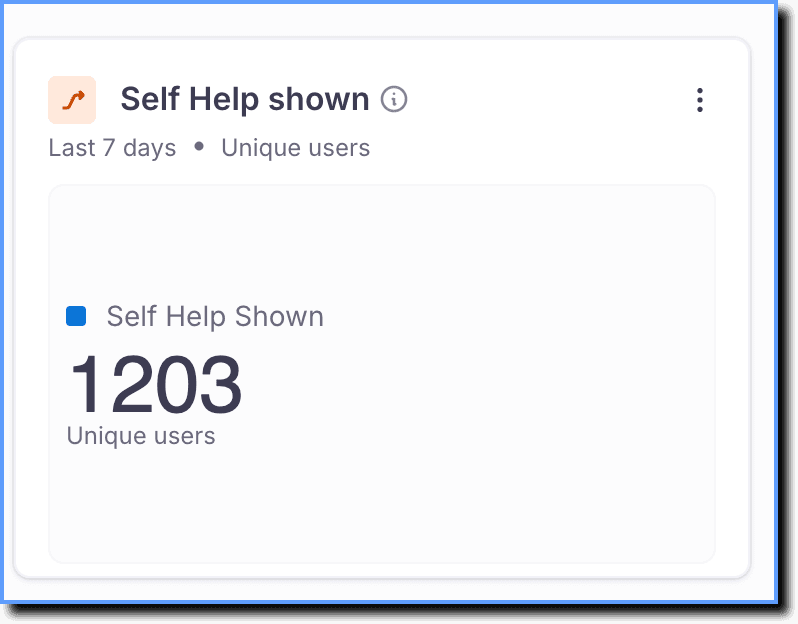 | The metric displays the total number of times the Self Help widget was shown to users in the given time period. This combined insight is for both old and new Self Help. | Self Help shown | - Clicks on Self Help (New) icon of Pin - Clicks on Explorer icon within the Pin on roll over - Self Help Shown | - Event Type - Event Trigger Location - device_browser_version | - Device - Location - URL/IP - User - Variables - Uncategorized |
Self Help Opened 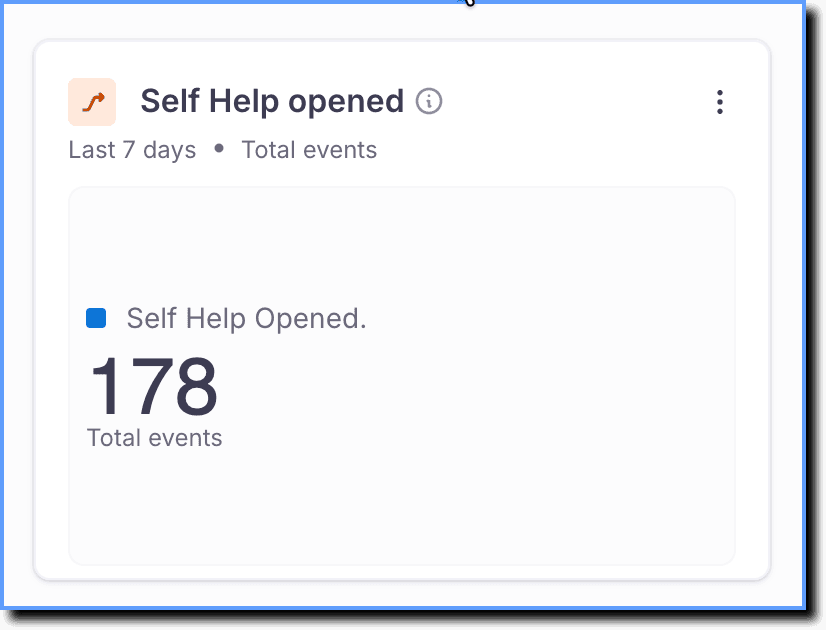 | The metric displays the total number of times users have opened the Self Help widget in the given time period. This combined insight is for both old and new Self Help. | Self Help Opened | - Clicks on Self Help (New) icon of Pin - Clicks on Explorer icon within the Pin on roll over - Self Help Opened | - Event Type - Event Trigger Location - device_browser_version | - Device - Location - URL/IP - User - Variables - Uncategorized |
Self Help engaged 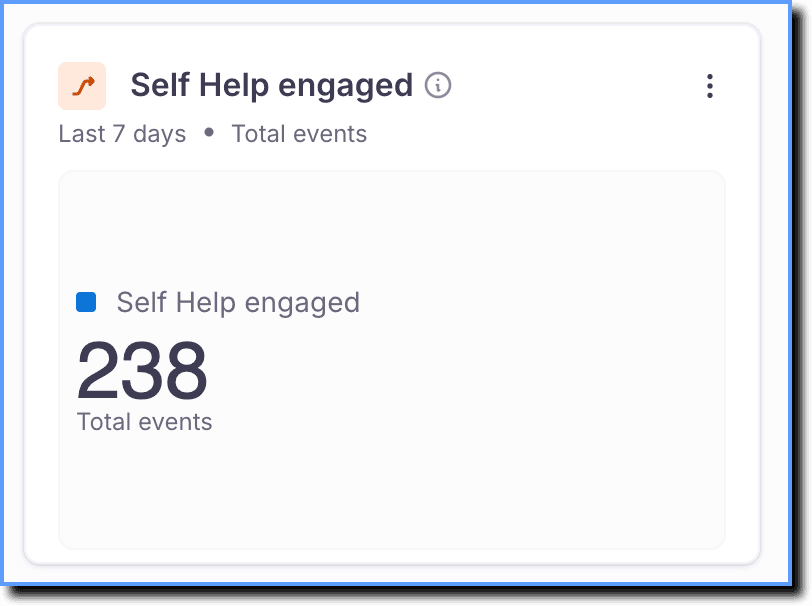 | The metric displays the total number of times users have engaged with content (click, successfully searched, successful Quickread response) in Self Help widget within the given time period. This combined insight is for both old and new Self Help. | Click on content within Explorer | - Clicks on Self Help (New) icon of Pin - Clicks on Explorer icon within the Pin on roll over - Clicks on content within Explorer - Self Help Opened | - Event Type - Event Trigger Location - device_browser_version | - Device - Location - URL/IP - User - Variables - Uncategorized |
Self Help queries served per day 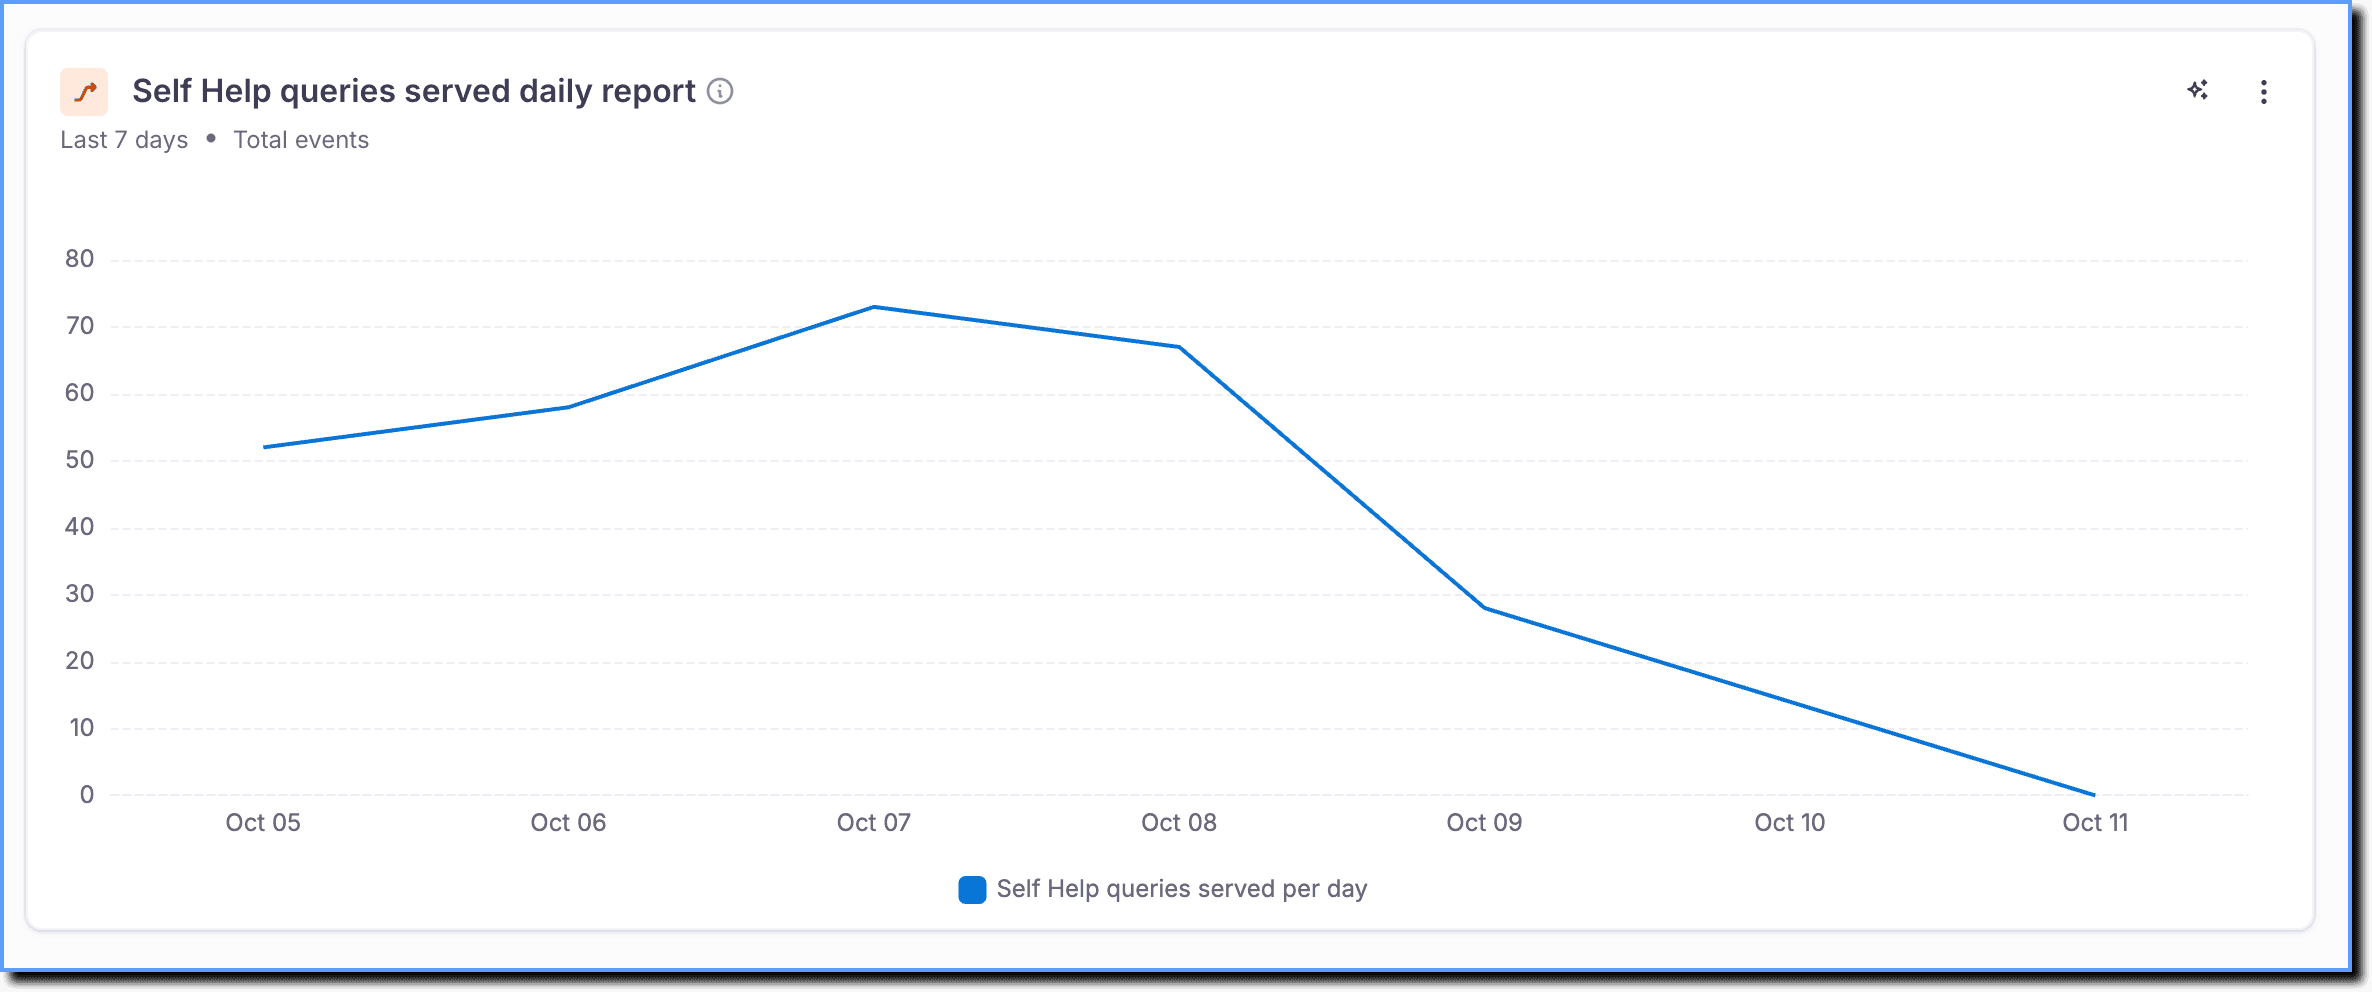 | The graph illustrates the daily frequency of user queries being served by Self Help and QuickRead over the given time period. This combined insight is for both old and new Self Help. | Self Help queries served per day | - Self Help Search - QuickRead response - Flow started - Video link clicked - Article viewed - Clicks on content within Explorer - Self Help (New) Explorer - Link opened in new format | - Segment Name - Event Type - Event Trigger Location - device_browser_version | - Device - Location - URL/IP - User - Variables - Uncategorized |
| Old Self Help Metrics: | |||||
Old Self Help content click report 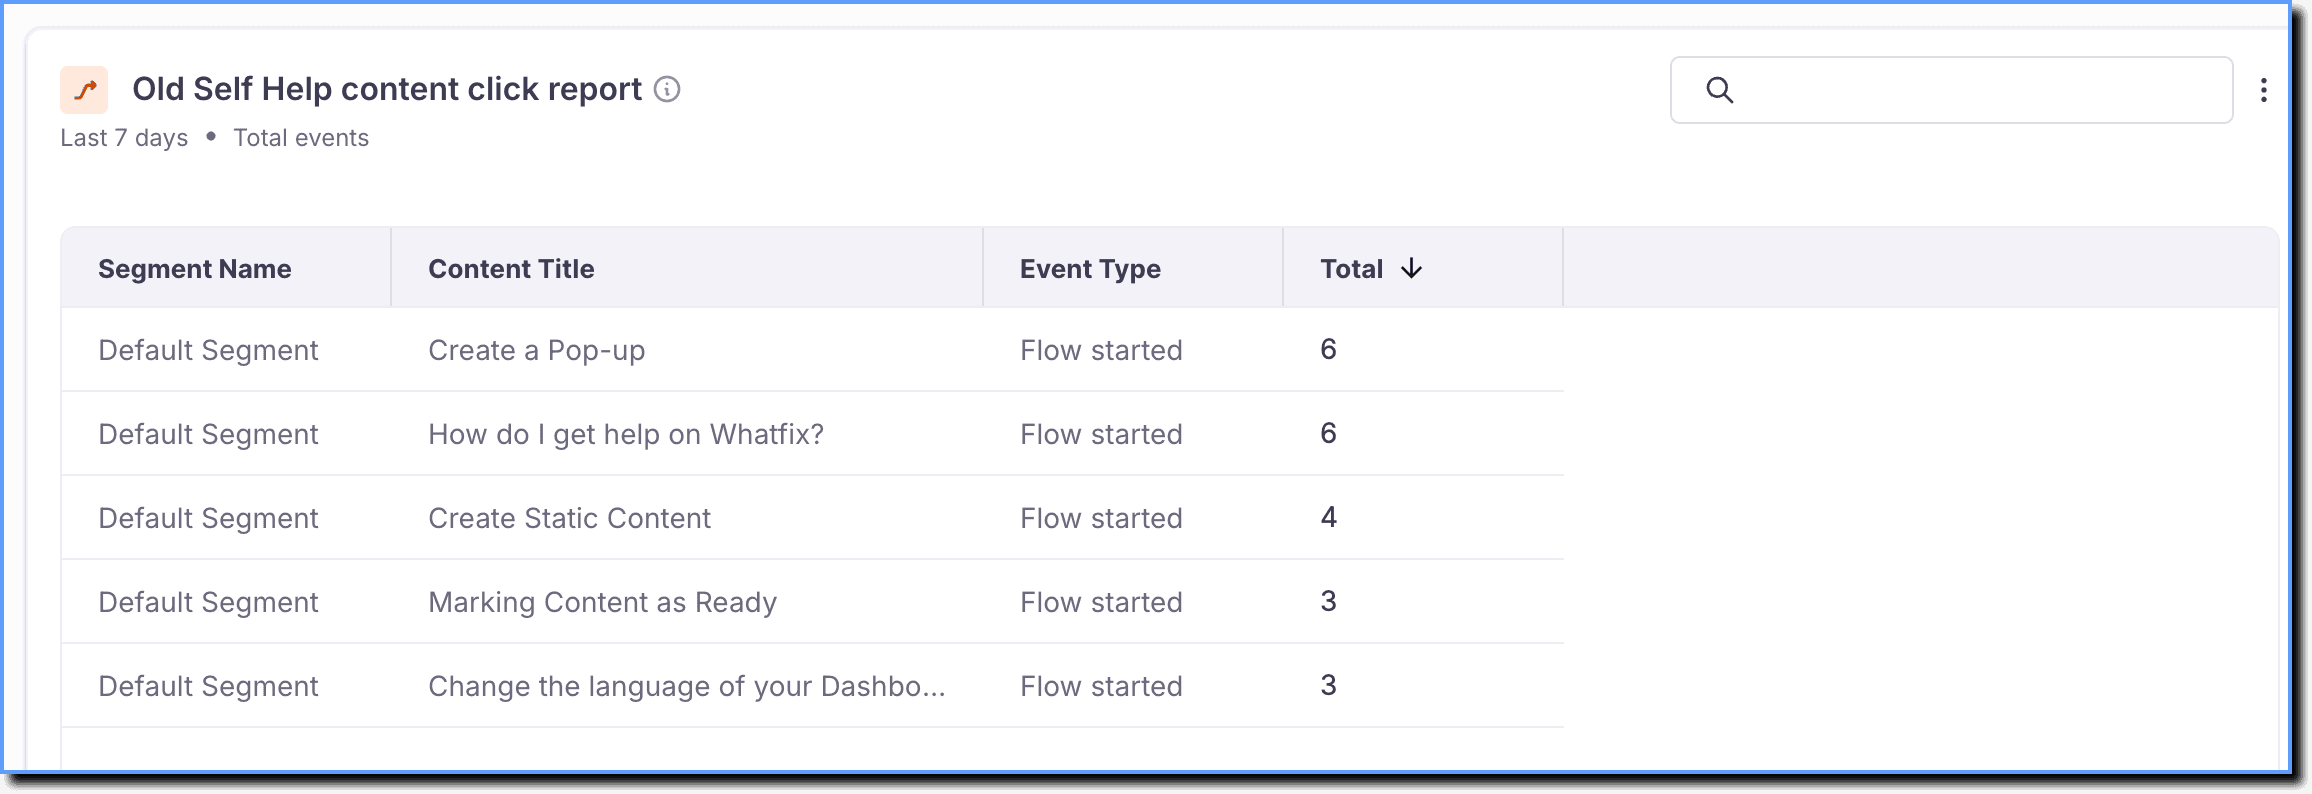 | The table displays the total number of times the users clicked on content items in the old Self Help widget within the given time period. | Content consumed in Self Help | - Flow started - Pdf Viewed - Link opened in new format - Video link clicked - Article viewed | - Content Title - Segment Name - Event Type - Event Trigger Location - device_browser_version | - Device - Location - URL/IP - User - Variables - Uncategorized |
Content consumption from QuickRead vs old Self Help 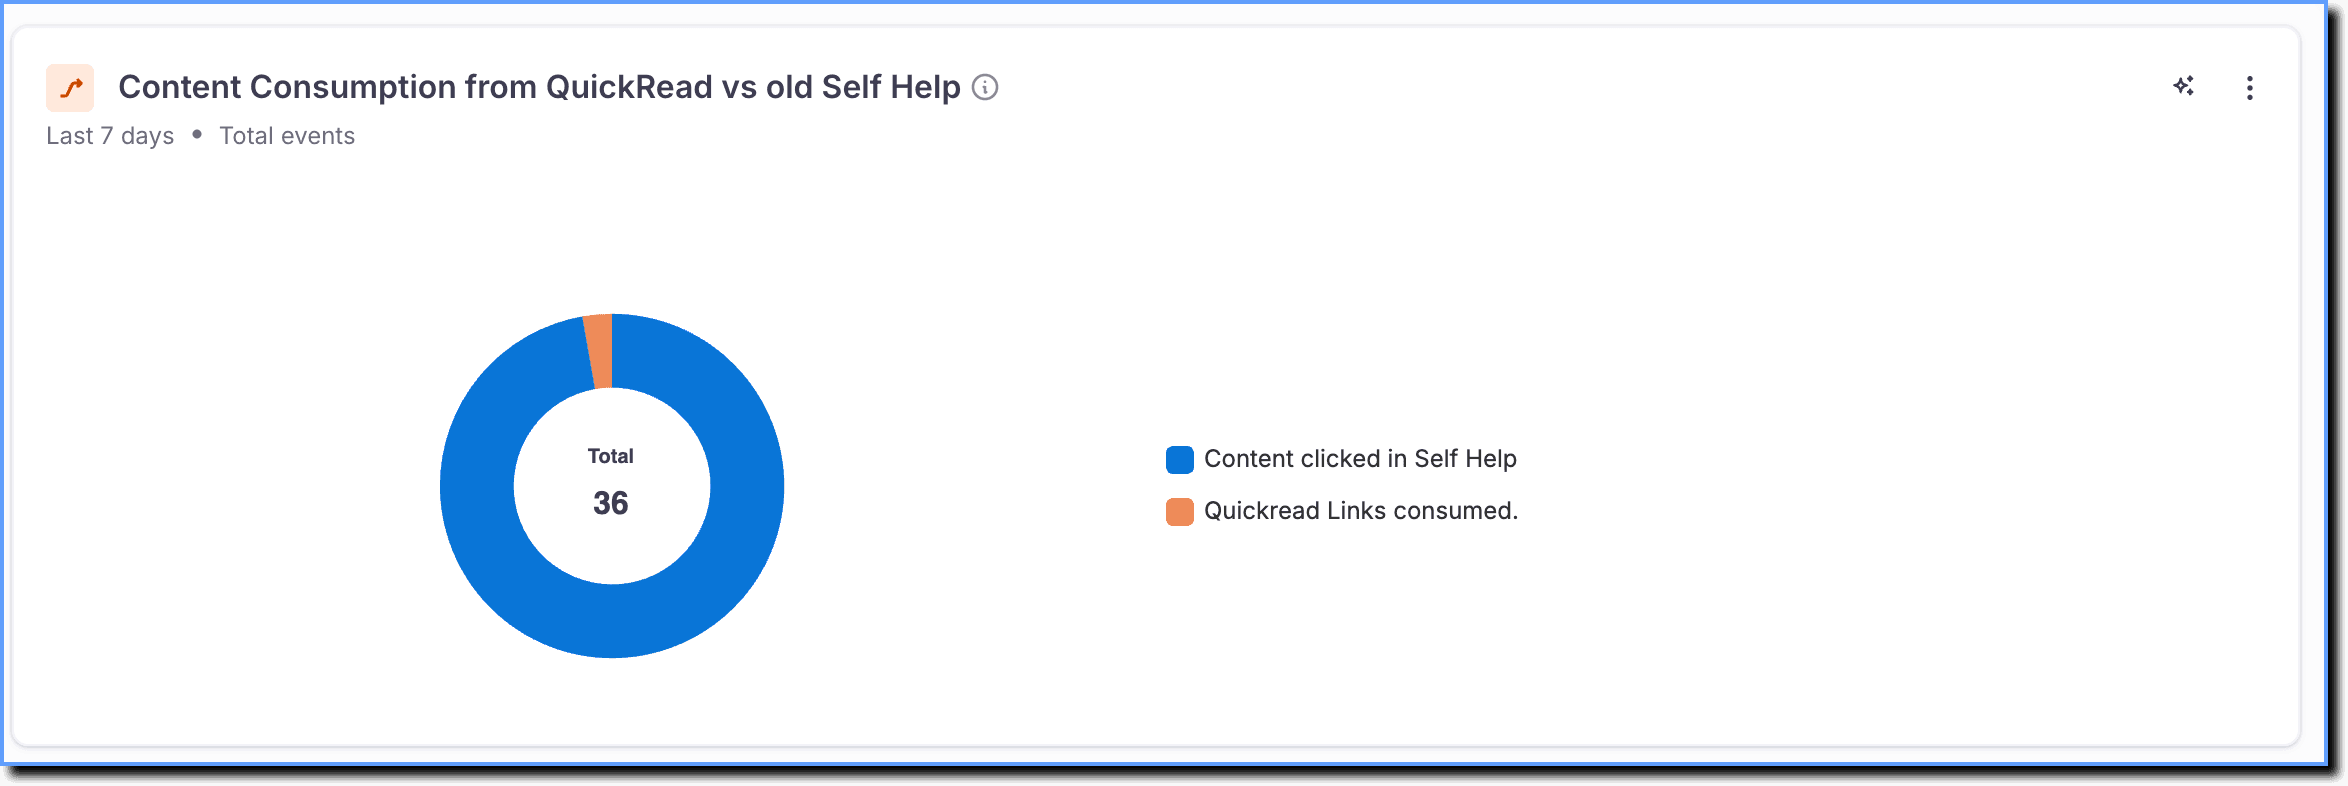 | This chart shows the percentage of instances where end users consumed links from QuickRead sources compared to content within old Self Help within a given time period. | Quickread Links consumed | QuickRead links consumed | - Segment Name - Content Type - EventType - Event Trigger Location - device_browser_version | - Device - Location - URL/IP - User - Variables - Uncategorized |
| New Self Help Metrics: | |||||
New Self Help content click report 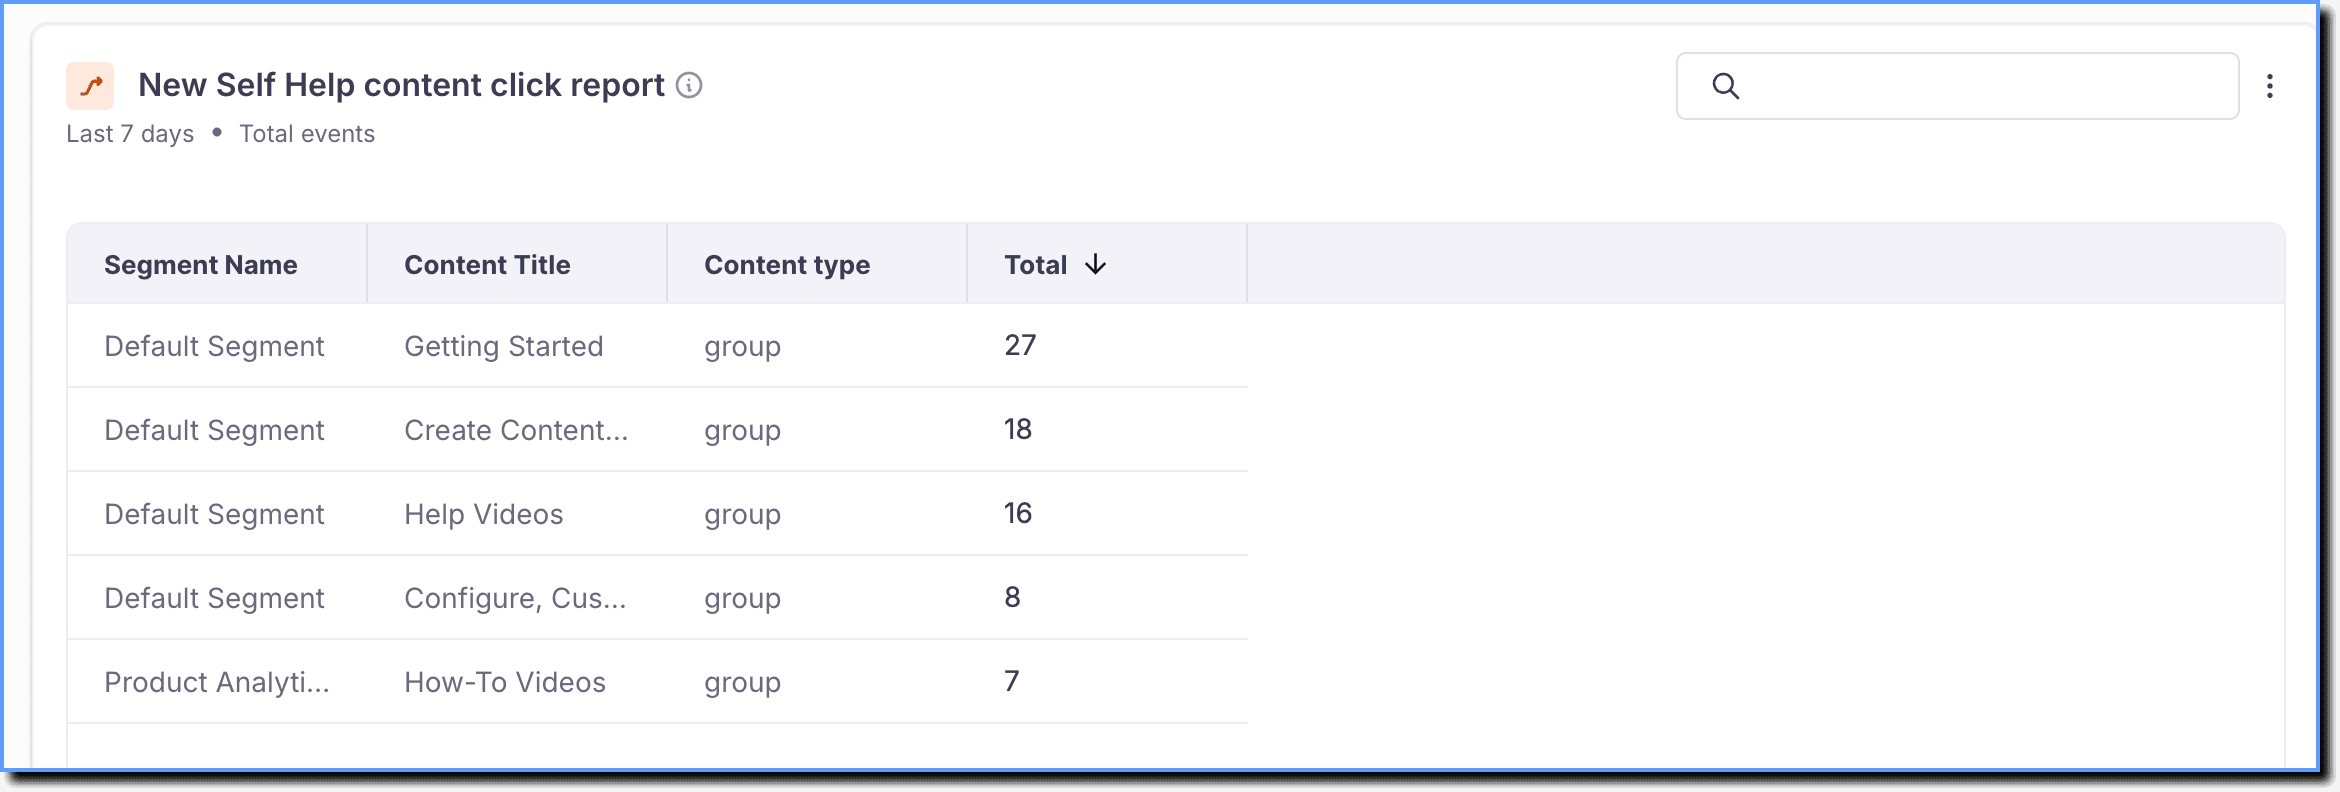 | The table displays the total number of times the users clicked on content items in the new Self Help widget within the given time period. | Click on content within Explorer | - Flow started - Pdf Viewed - Link opened in new format - Video link clicked - Article viewed | - Content Title - Segment Name - Event Type - Event Trigger Location - device_browser_version | - Device - Location - URL/IP - User - Variables - Uncategorized |
Content Consumption from QuickRead vs new Self Help 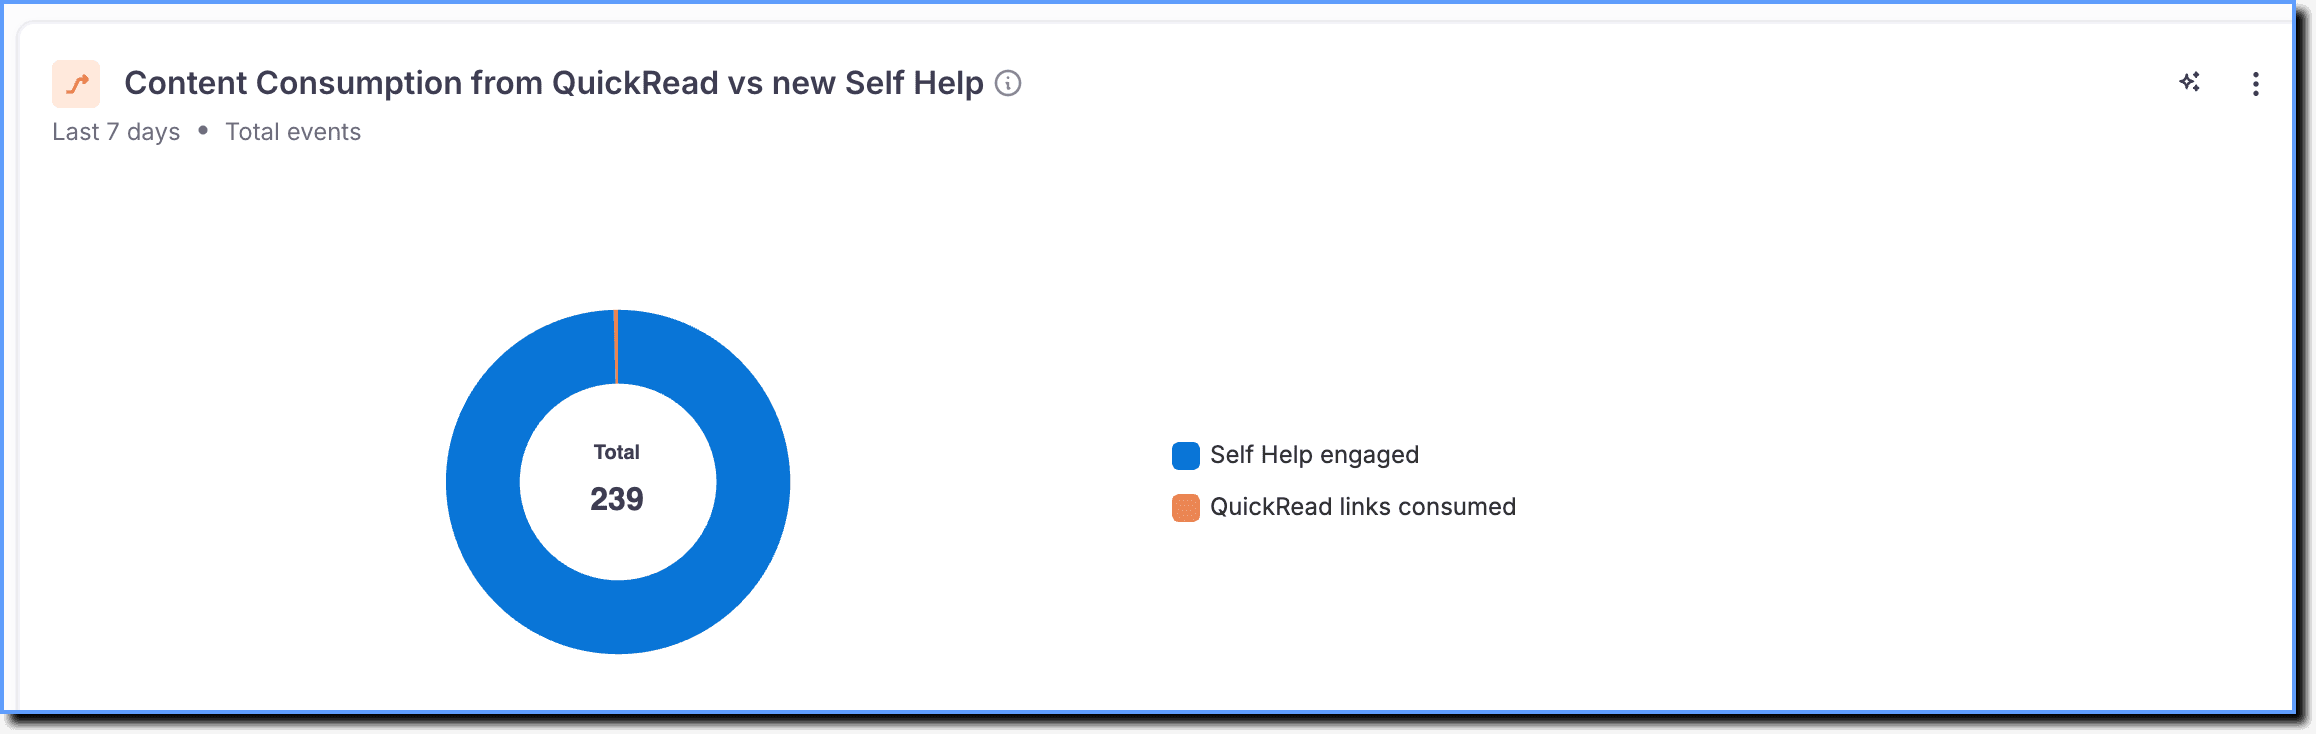 | This chart shows the percentage of instances where end users consumed links from QuickRead sources compared to content within new Self Help within a given time period. | - Quickread Links consumed - Content consumed from Self Help | - QuickRead links consumed - Flow started - Clicks on content within Explorer - Pdf Viewed - Link opened in new format - Video link clicked - Article viewed | - Segment Name - Content Type - EventType - Event Trigger Location - device_browser_version | - Device - Location - URL/IP - User - Variables - Uncategorized |
To know more about Event Groups, Event Filters, and User Filters, see the following articles:
Successful and unsuccessful search terms
The Successful and Unsuccessful Search tab on the Dashboard displays the percentage of successful and unsuccessful searches. It also lists search terms that returned results in Self Help and those that did not.
The following table shows the metrics available on the Successful and Unsuccessful Search Dashboard:
| Metric | Description | Event Group | Events Included | Event Filters | User Filters |
|---|---|---|---|---|---|
| Combined Metrics: | |||||
Old and new Self Help unsuccessful search feedback report 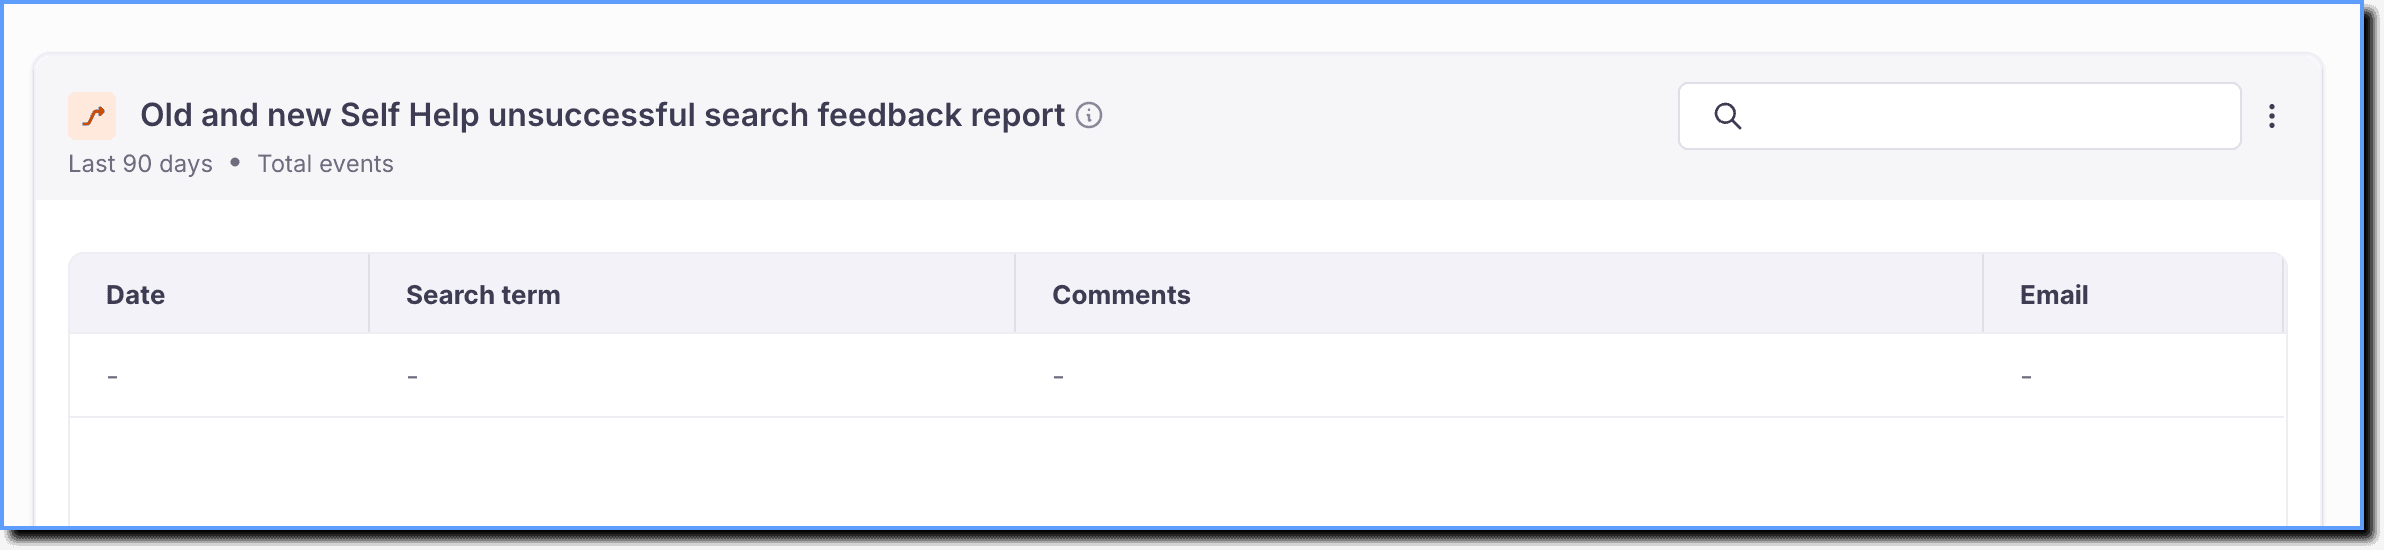 | Displays a table showing a breakdown of feedback for unsuccessful search experience. This insight is for both the Old and New Self Help experiences. | — | Self help search feedback | - Search term - Comments - Date - Email | - Device - Location - URL/IP - User - Variables - Uncategorized |
| Old Self Help Metrics: | |||||
Old Self Help search breakdown 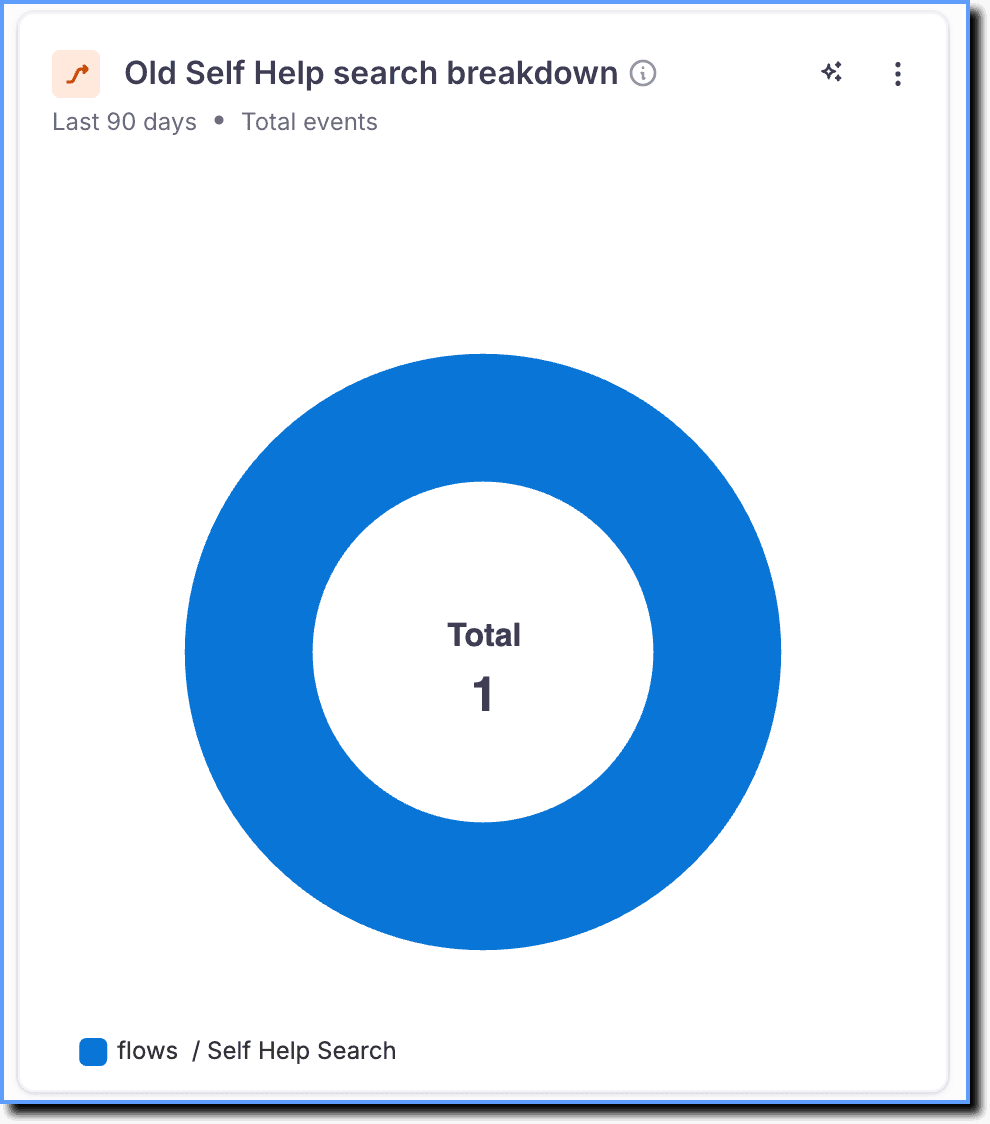 | This chart shows the breakdown of successful and unsuccessful search results delivered by old Self Help excluding QuickRead within the given time period. | — | Self Help Search | - Search Term - Segment Name - Event Trigger Location - device_browser_version | - Device - Location - URL/IP - User - Variables - Uncategorized |
Old Self Help successful search terms 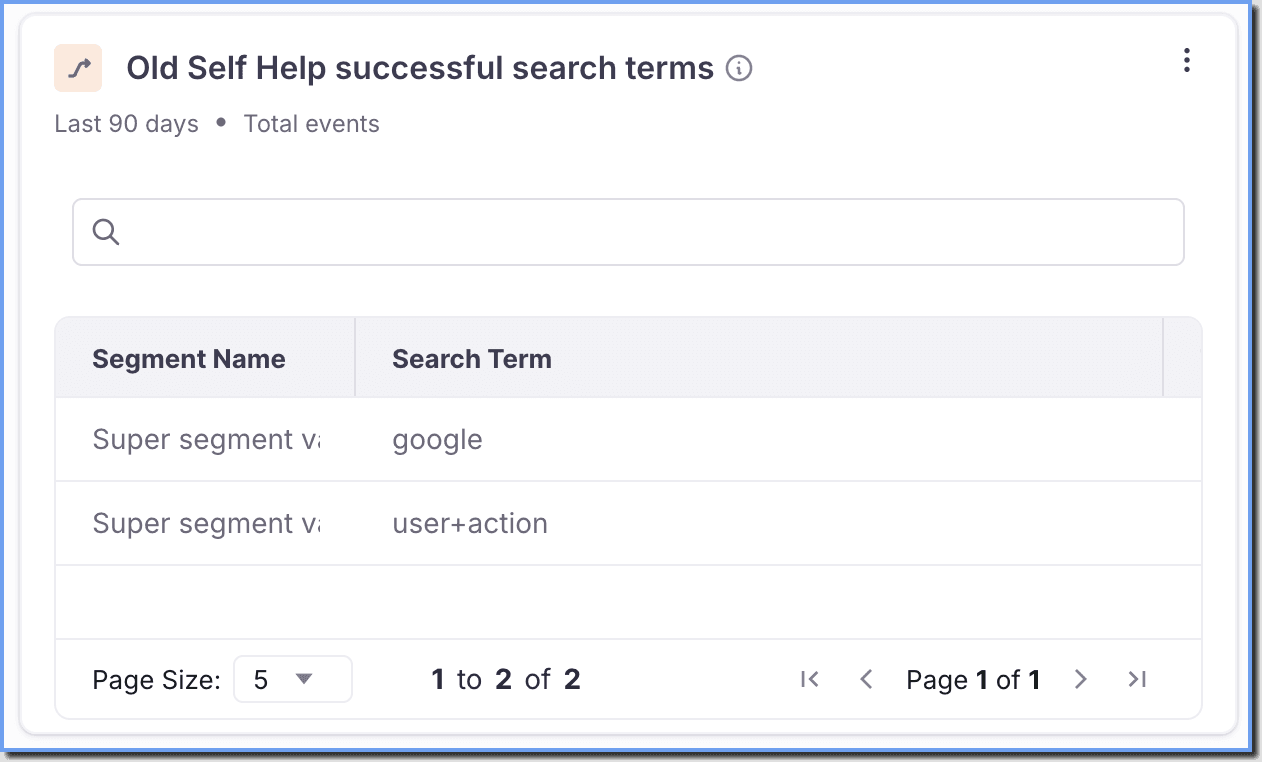 | Displays the search terms and the number of times successful search results are provided in the Old Self Help, excluding QuickRead. | — | Self Help Search | - Search Results - Search Term - Event Trigger Location - Segment Name - device_browser_version | - Device - Location - URL/IP - User - Variables - Uncategorized |
Old Self Help unsuccessful search terms 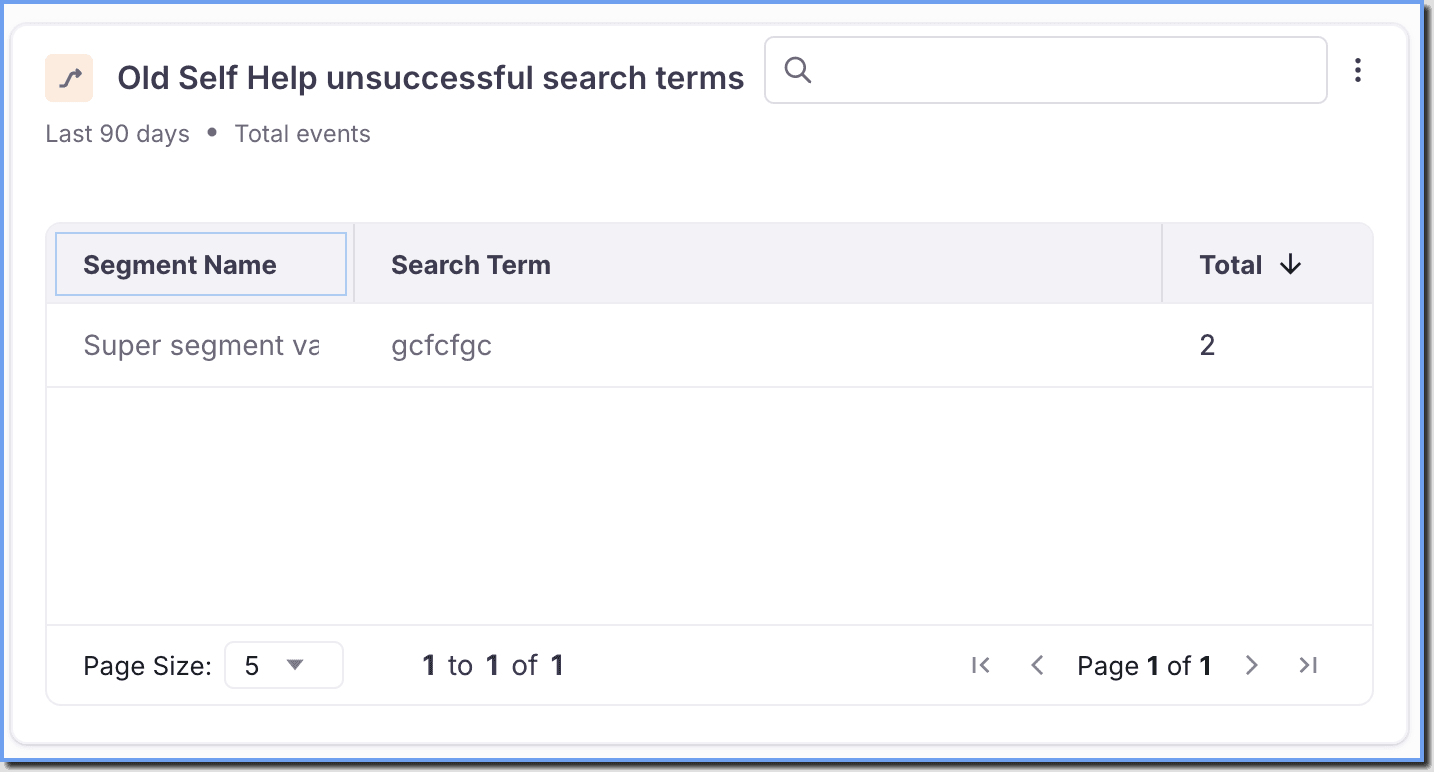 | Displays the search terms and the number of times unsuccessful search results are provided in the Old Self Help, excluding QuickRead. | — | Self Help Search | - Search Results - Search Term - Event Trigger Location - Segment Name - device_browser_version | - Device - Location - URL/IP - User - Variables - Uncategorized |
| New Self Help Metrics: | |||||
New Self Help search breakdown 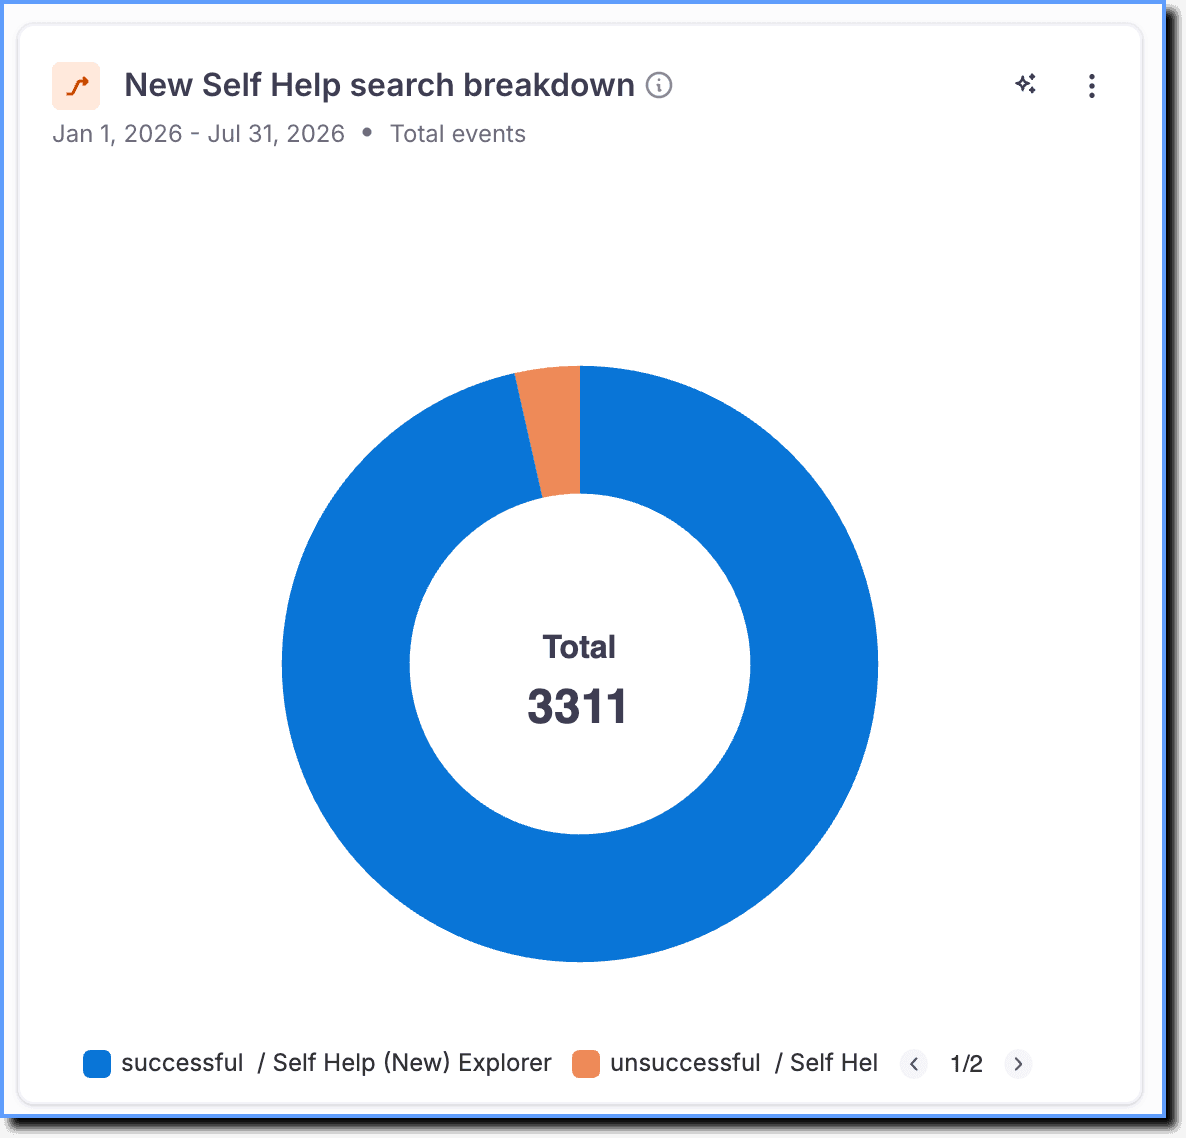 | A breakdown of total successful and unsuccessful search results from new Self Help, excluding Quick Read. | — | Self Help Search | - Search Results - Search Term - Event Trigger Location - Segment Name - device_browser_version | - Device - Location - URL/IP - User - Variables - Uncategorized |
New Self Help content consumed from search 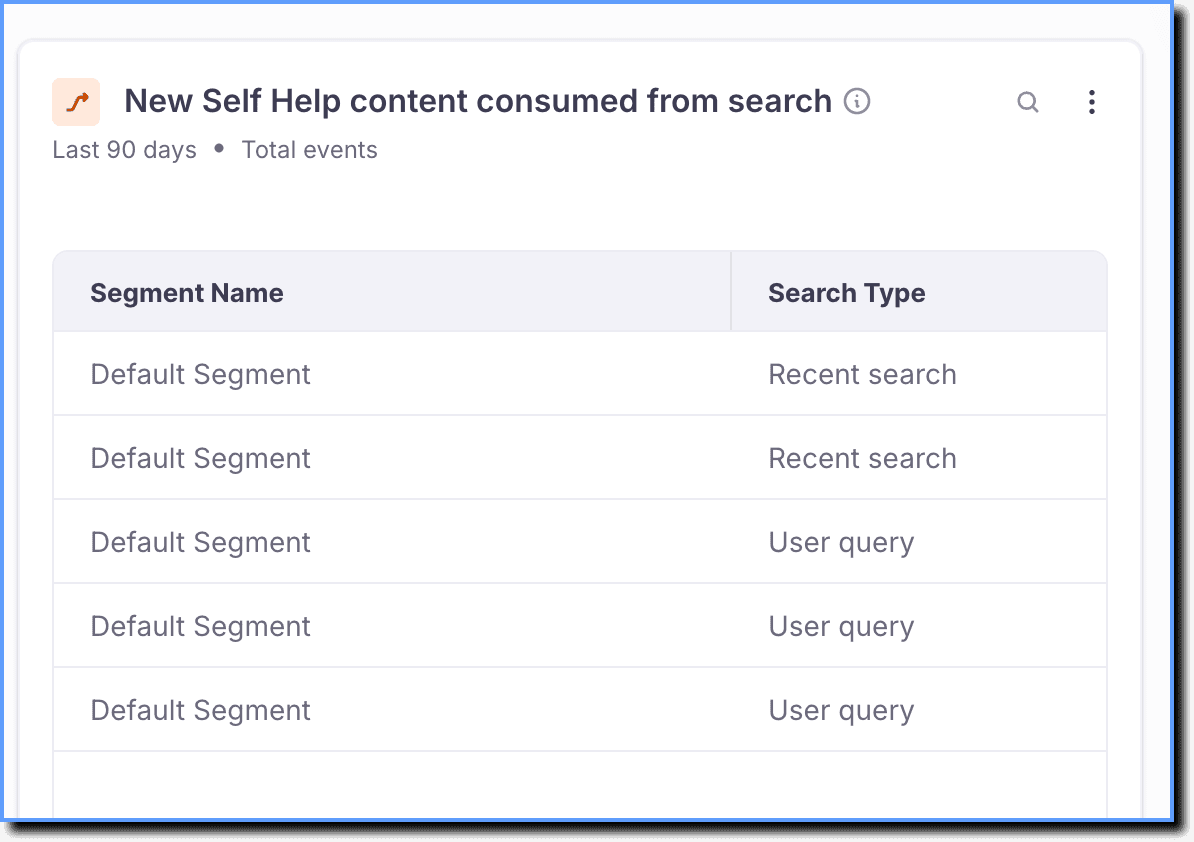 | The report shows content consumed (such as links clicked) from new Self Help. | Self Help (New) Explorer | — | - Search success - Event Trigger Location - Segment Name - Page url - device_browser_version - Search time - Search term - Search type - Filters | - Device - Location - URL/IP - User - Variables - Uncategorized |
New Self Help successful search report 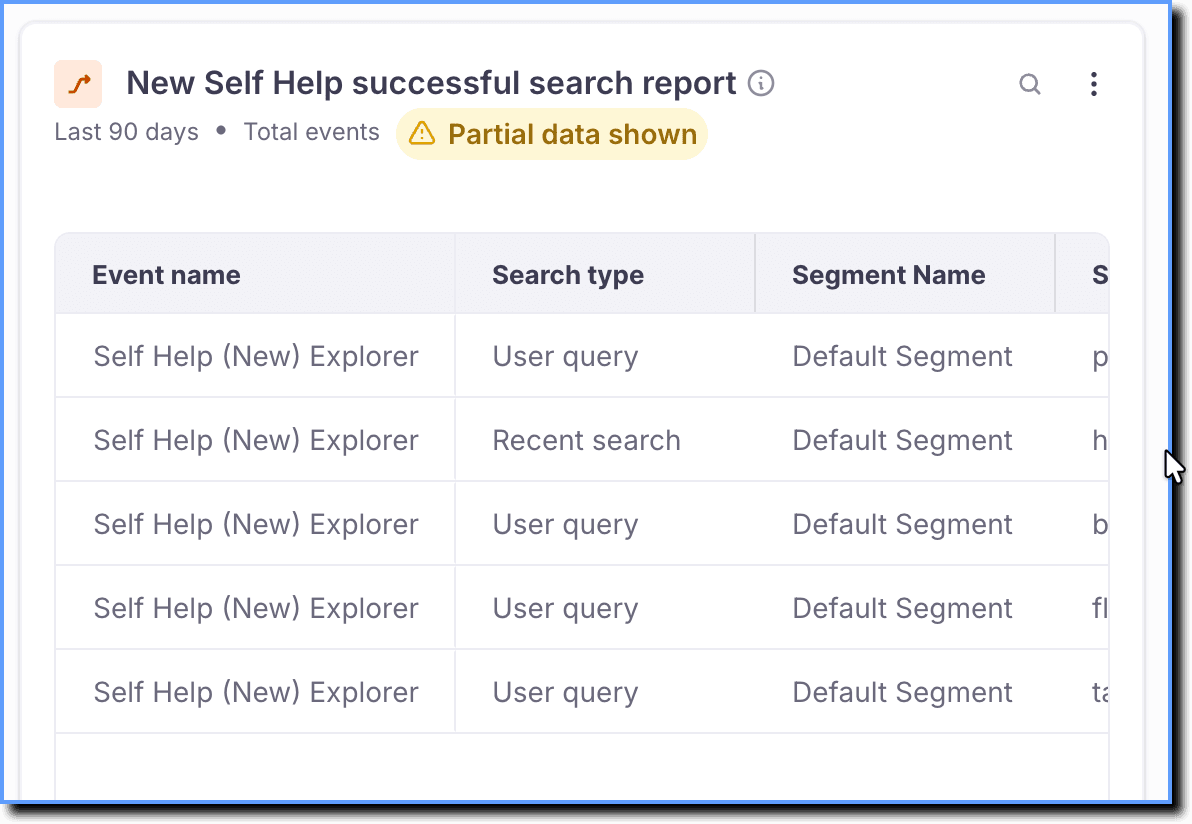 | The report shows search terms and total instances of successful search results delivered by new Self Help, excluding Quick Read. | Self Help (New) Explorer | — | - Search success - Event Trigger Location - Segment Name - Page url - device_browser_version - Search time - Search term - Search type - Filters | - Device - Location - URL/IP - User - Variables - Uncategorized |
New Self Help unsuccessful search report 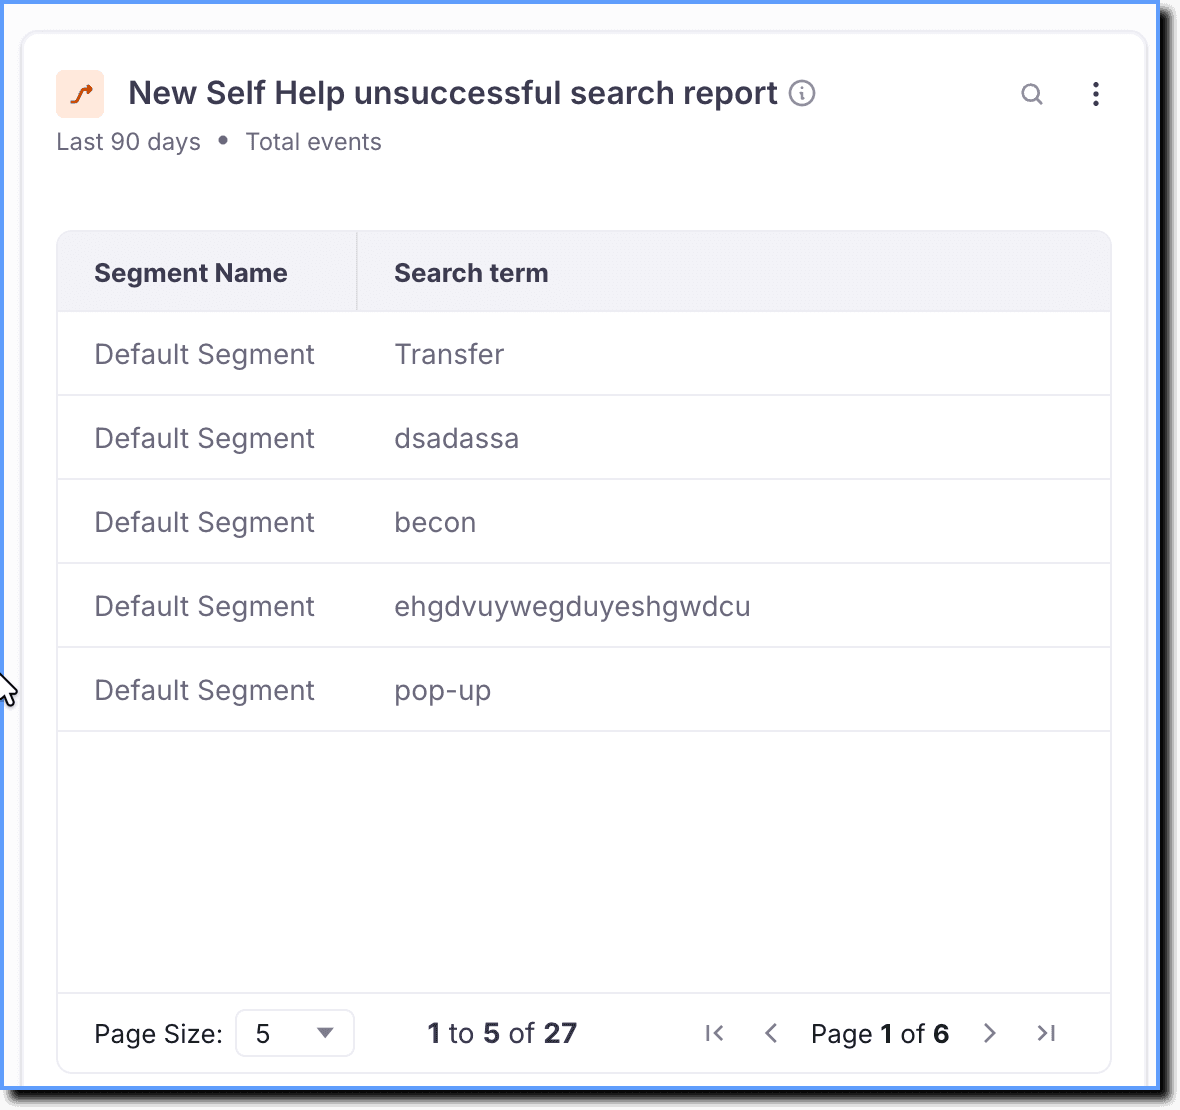 | The report shows search terms and total instances of unsuccessful search results delivered by new Self Help, excluding Quick Read. | Self Help (New) Explorer | — | - Search success - Event Trigger Location - Segment Name - Page url - device_browser_version - Search time - Search term - Search type - Filters | - Device - Location - URL/IP - User - Variables - Uncategorized |
To know more about Event Groups, Event Filters, and User Filters, see the following articles:
QuickRead
The QuickRead tab on the Dashboard displays the QuickRead analytics.
The following table shows the metrics available on the QuickRead Dashboard:
| Metric | Description | Event Group | Events Included | Event Filters | User Filters |
|---|---|---|---|---|---|
| Combined Metrics: | |||||
Old and New Self Help QuickRead feedback 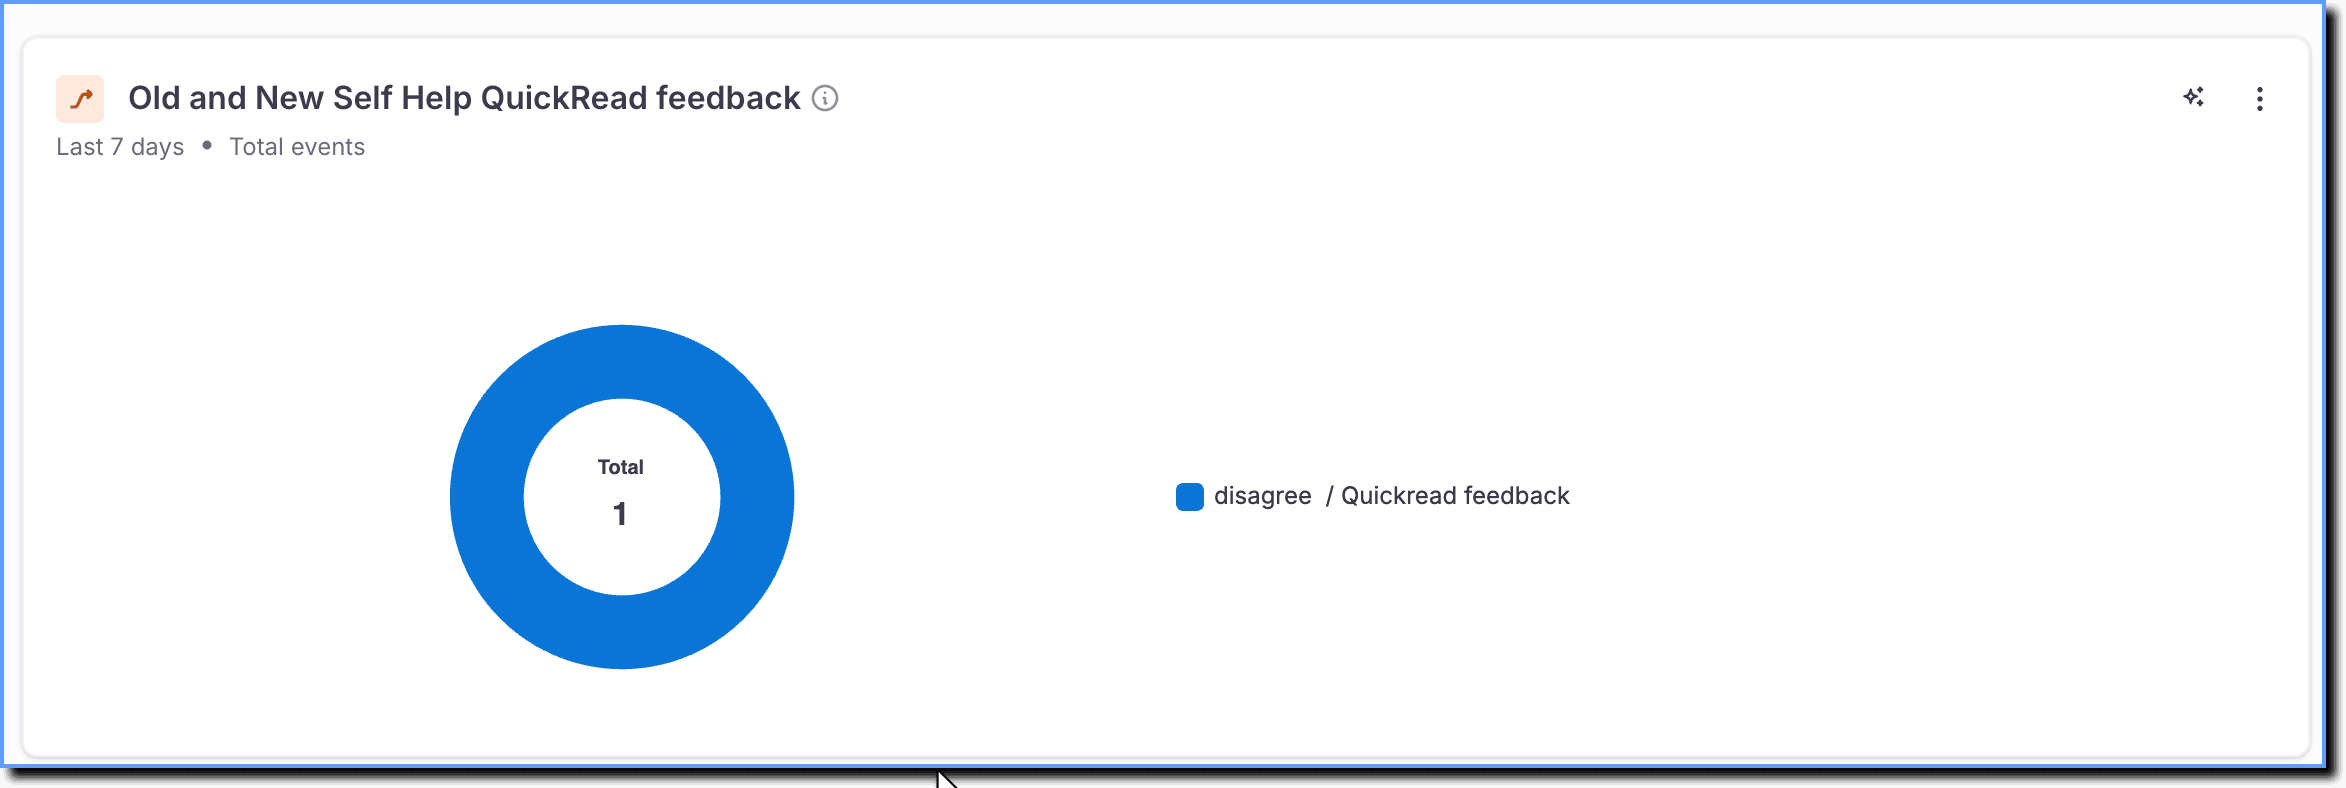 | The chart displays the percentage of successful QuickRead responses compared to instances where no QuickRead response was provided by both old & new Self Help widget within the given time period as applicable. | QuickRead feedback | - QuickRead feedback - QuickRead Feedback | - Feedback option - Segment Name - Event Type - Event Trigger Location - device_browser_version | - Device - Location - URL/IP - User - Variables - Uncategorized |
| Old Self Help Metrics: | |||||
Old Self Help QuickRead success rate 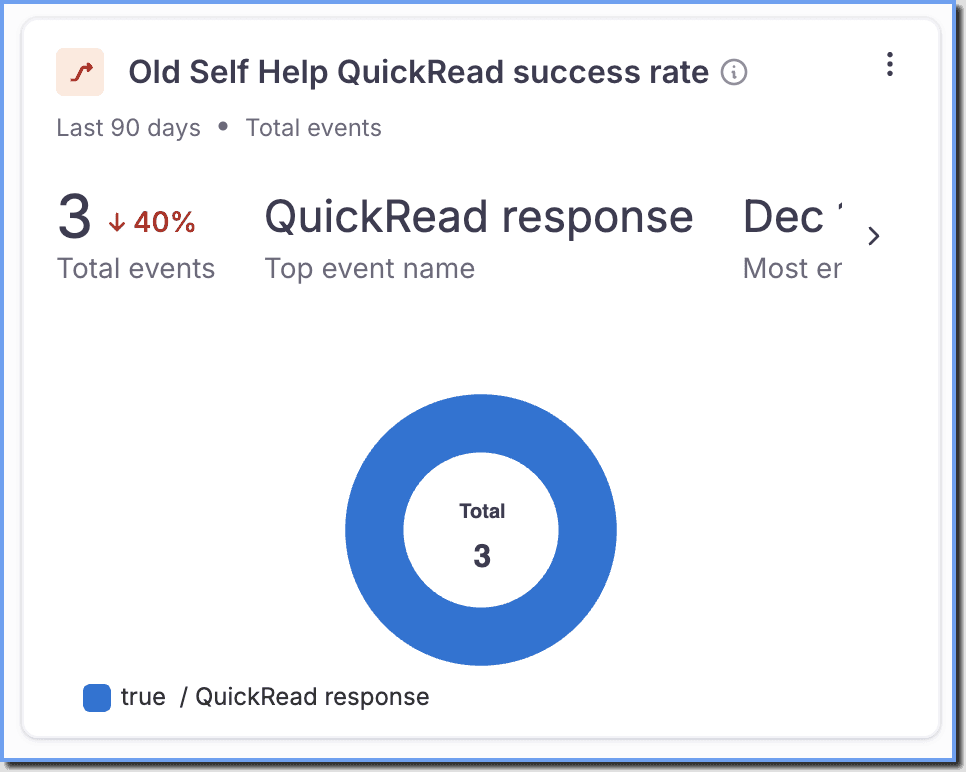 | The chart displays the percentage of successful QuickRead responses compared to instances where no QuickRead response was provided by the old Self Help widget within the given time period. | QuickRead response | — | - Event Trigger Location - device_browser_version - Search term - Response success - Segment Name - Event trigger page url - Query Type | - Device - Location - URL/IP - User - Variables - Uncategorized |
Old Self Help QuickRead response report 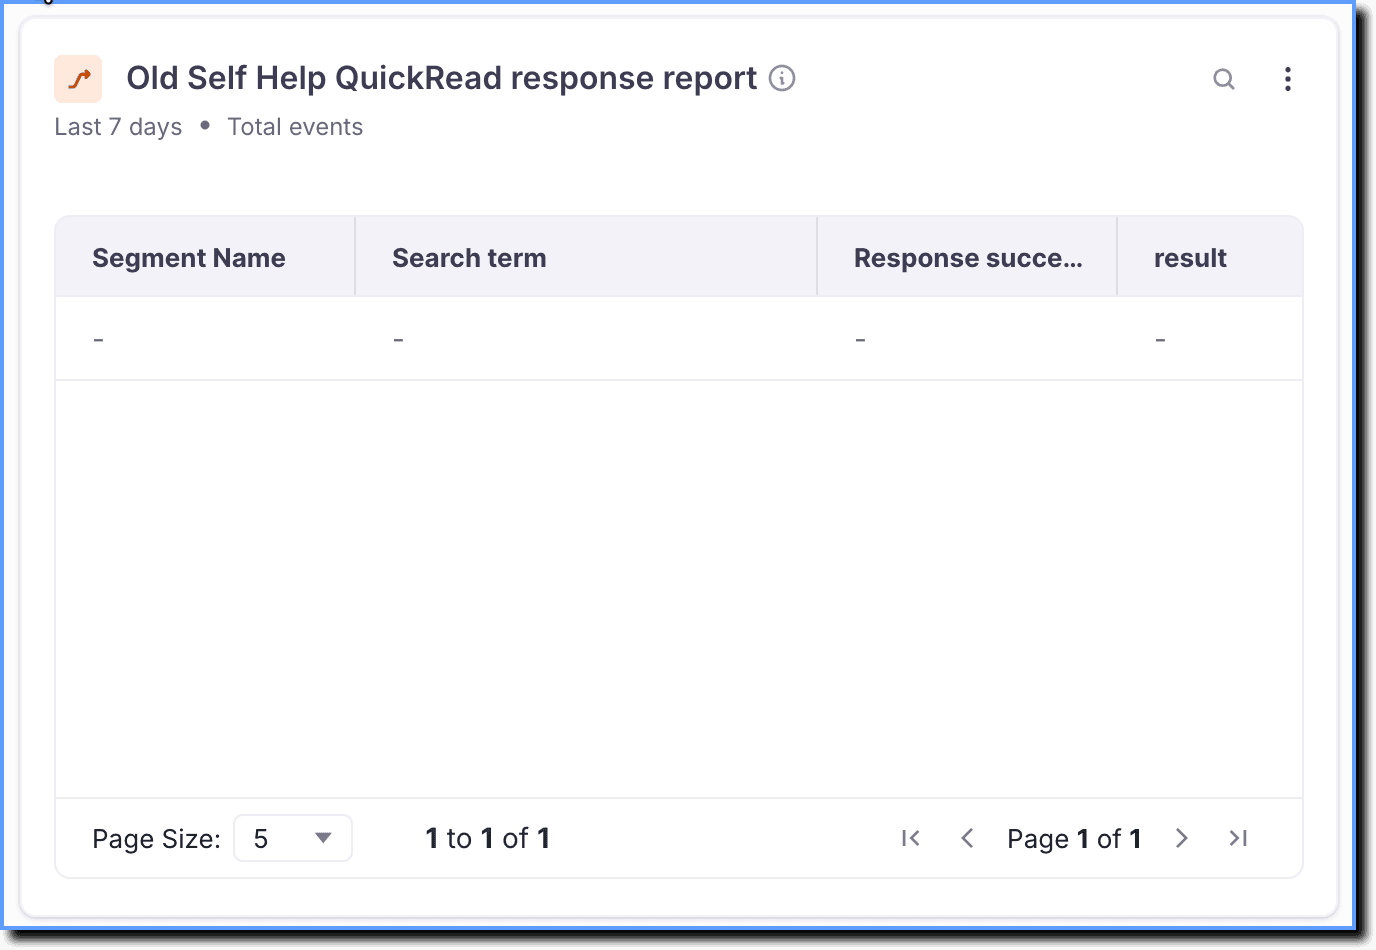 | This table displays a report with a breakdown of QuickRead responses shown for end user queries along with other details provided by the old Self Help within the given time period. | QuickRead response | — | - Event Trigger Location - device_browser_version - Search term - Response success - Segment Name - Event trigger page url - Query Type | - Device - Location - URL/IP - User - Variables - Uncategorized |
| New Self Help Metrics: | |||||
New Self Help QuickRead success rate 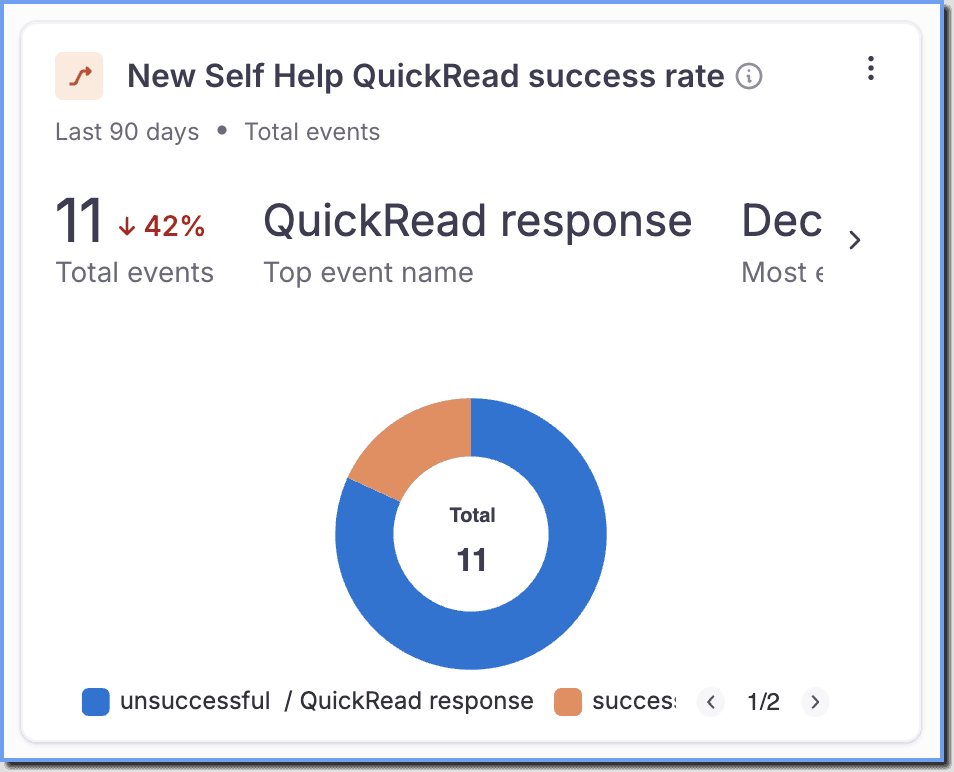 | The chart displays the percentage of successful QuickRead responses compared to instances where no QuickRead response was provided by the new Self Help widget within the given time period. | QuickRead response | — | - Segment Name - device_browser_version - Event Trigger Location - Search term - Response success - Event trigger page url - Response success | - Device - Location - URL/IP - User - Variables - Uncategorized |
New Self Help QuickRead response report 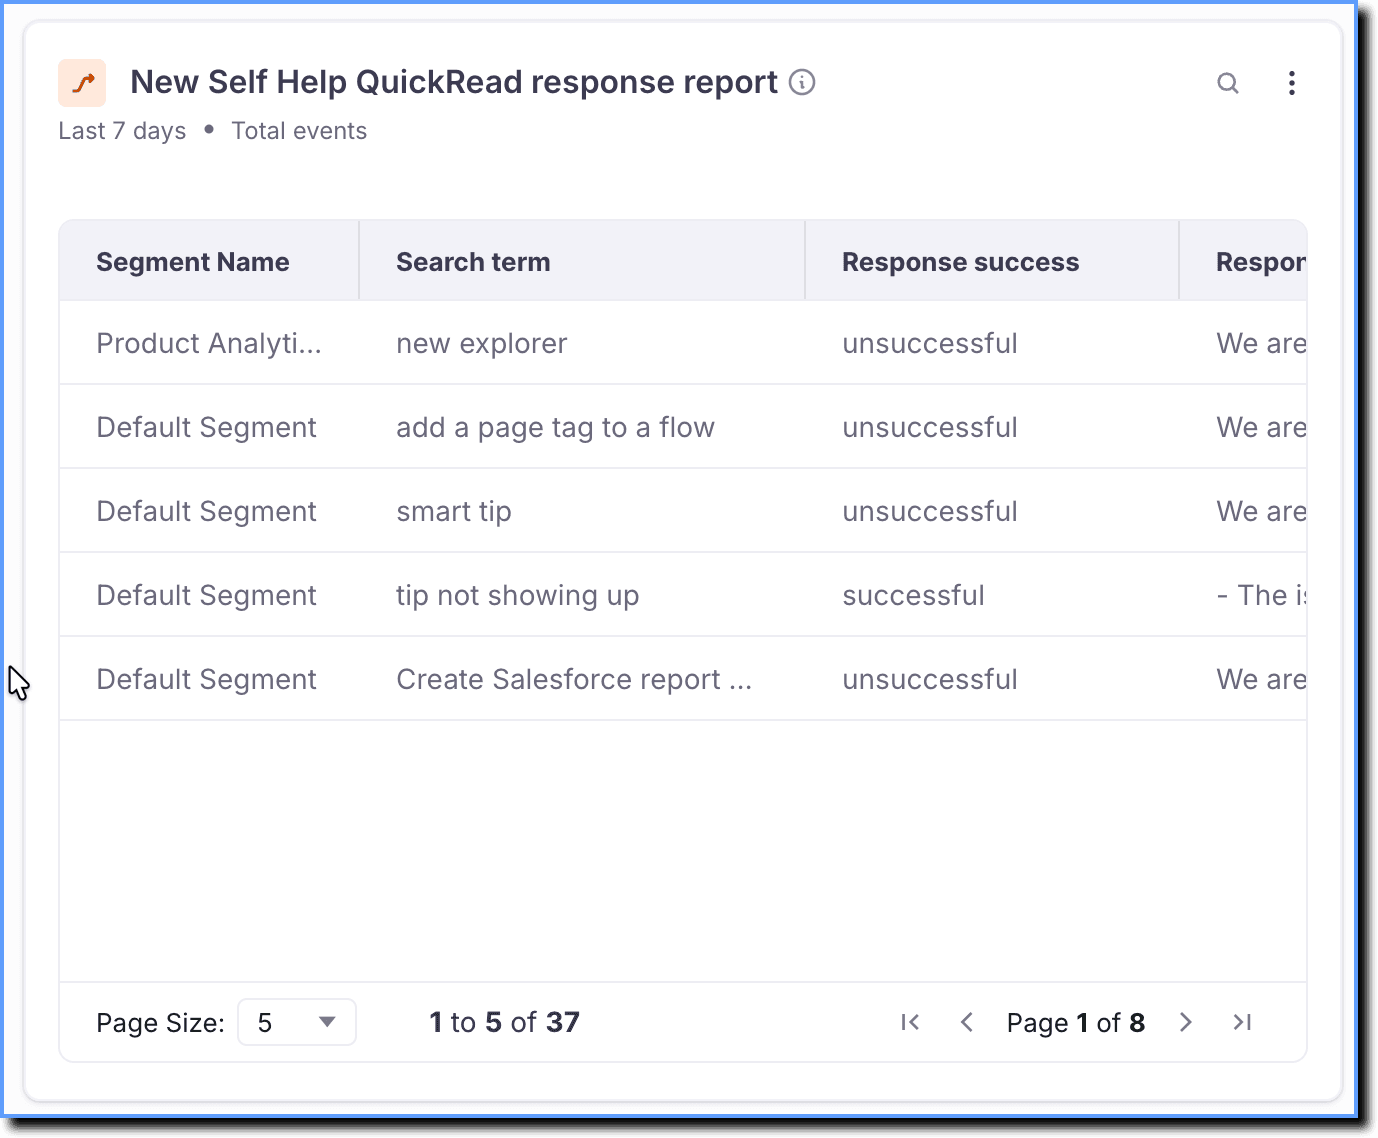 | This table displays a report of successful QuickRead responses generated for the end user queries for the new Self Help within the given time period. | QuickRead response | — | - Segment Name - device_browser_version - Event Trigger Location - Search term - Response success - Event trigger page url - Response success | - Device - Location - URL/IP - User - Variables - Uncategorized |
New Self Help QuickRead feedback for inaccurate responses  | The table displays the feedback given by end users for inaccurate QuickRead responses for the new Self Help within the given time period. | QuickRead response | — | - Segment Name - device_browser_version - Event Trigger Location - Search term - Response success - Event trigger page url - Response success | - Device - Location - URL/IP - User - Variables - Uncategorized |
To know more about Event Groups, Event Filters, and User Filters, see the following articles:
Feedback
The Feedback tab on the Dashboard displays the feedback given by end users when they can’t find what they’re looking for on Self Help (Search feedback) and the feedback given by end users regarding the content on Self Help (End-user feedback).
The following table shows the metrics available on the Feedback Dashboard:
| Metric | Description | Event Group | Event Filters | User Filters |
|---|---|---|---|---|
#### End-user feedback 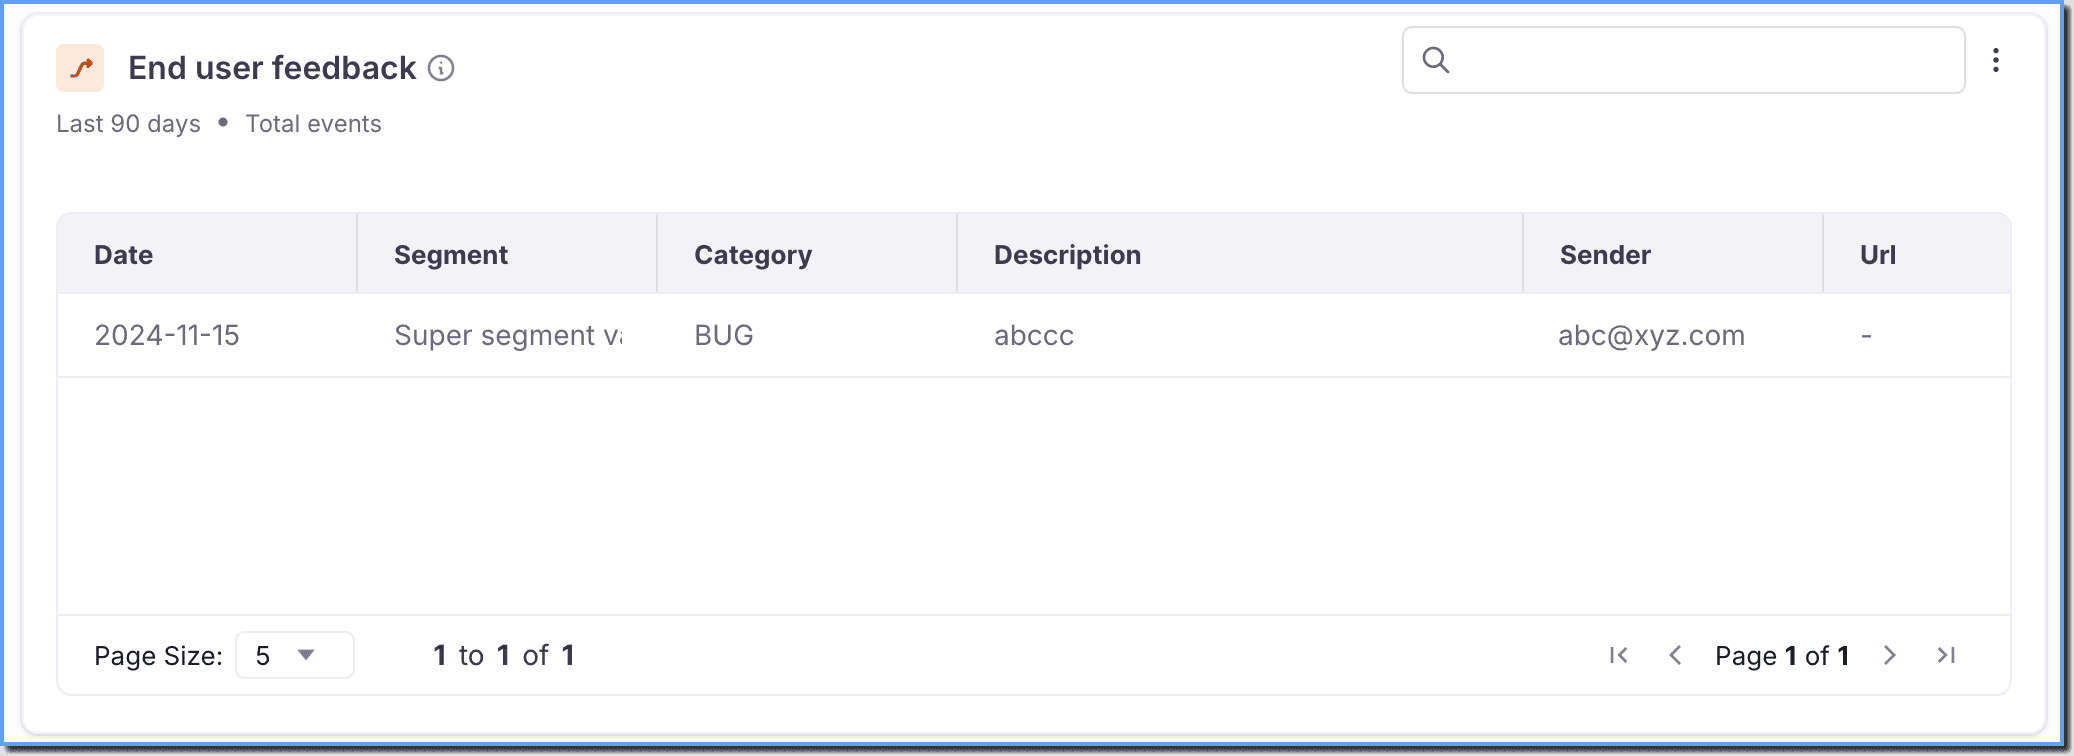 | Displays the feedback given by end users on the content on Self Help. This insight is for both Old and New Self Help. | Self help end user feedback | - Description - Attachment - Url - Sender - Category - Date - Segment - Has Attachments | - Device - Location - URL/IP - User - Variables - Uncategorized |
To filter end-user feedback captured from a specific page, use the following steps:
- Go to the Feedback section.
- Click the Menu icon.
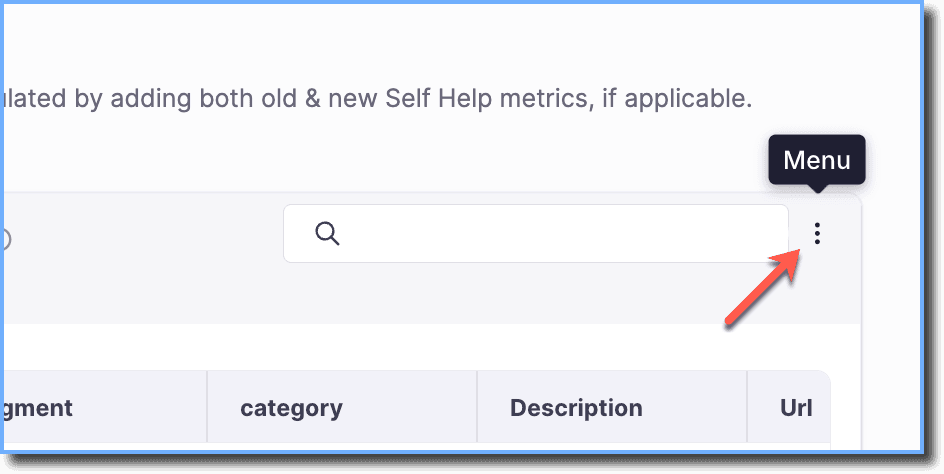
- Click Filter.
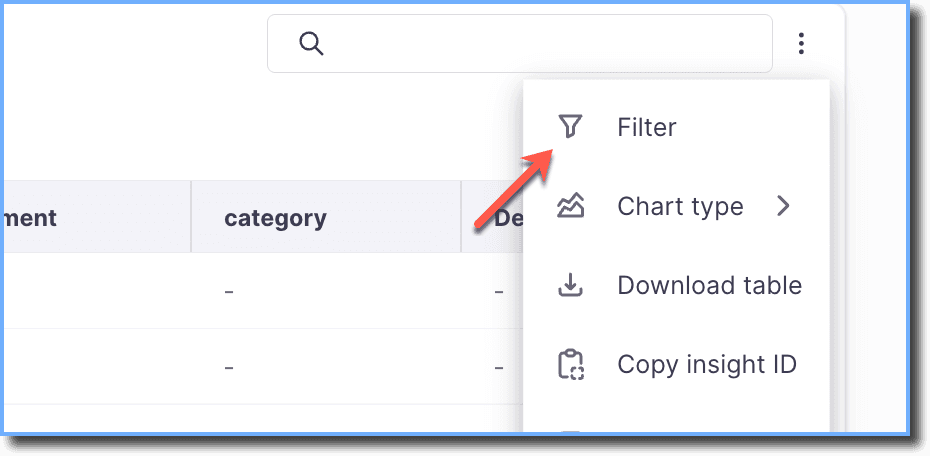
- Click Event Filters.
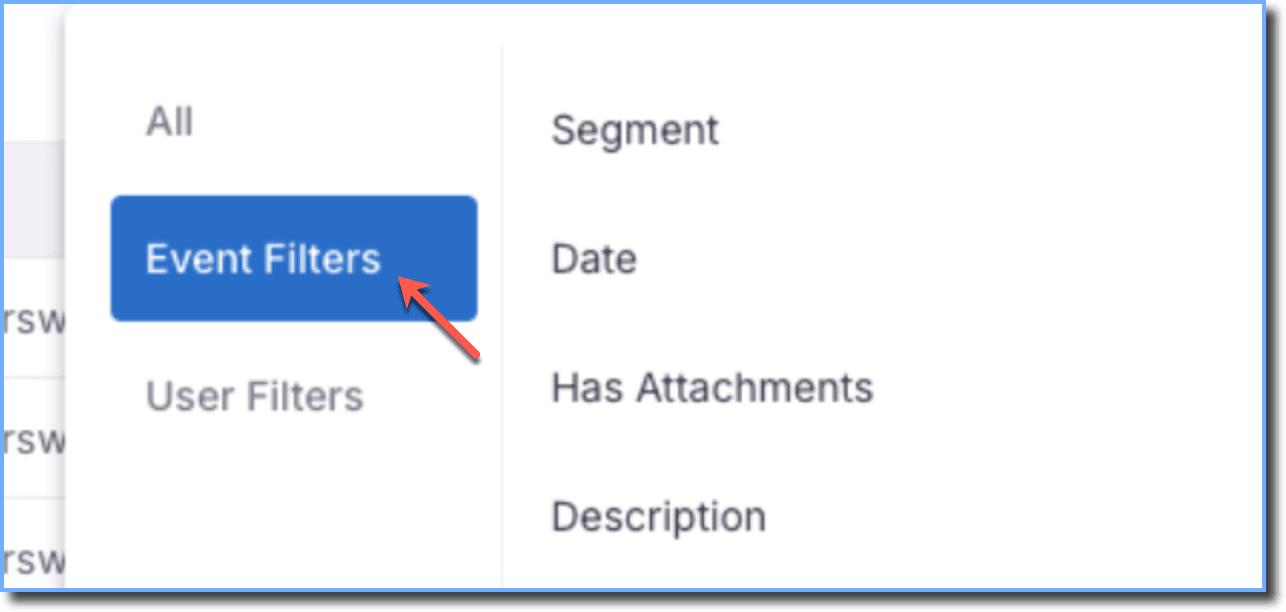
- Select Self help end user feedback.
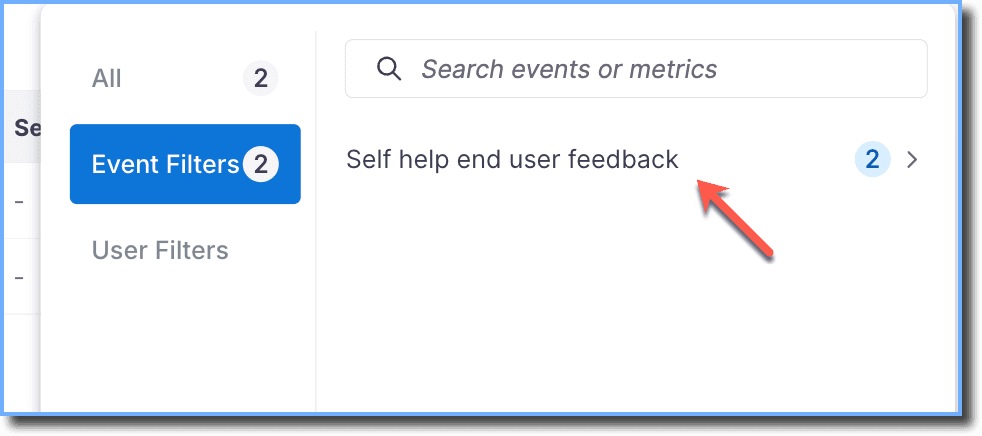
- Select Url.
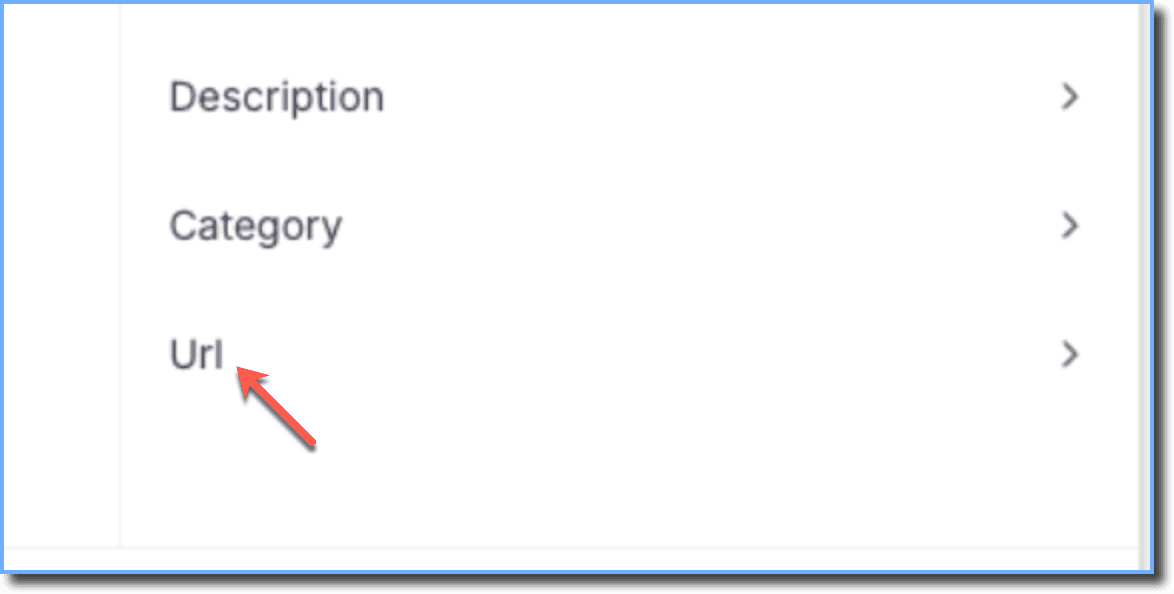
- Select the URLs and click Apply.
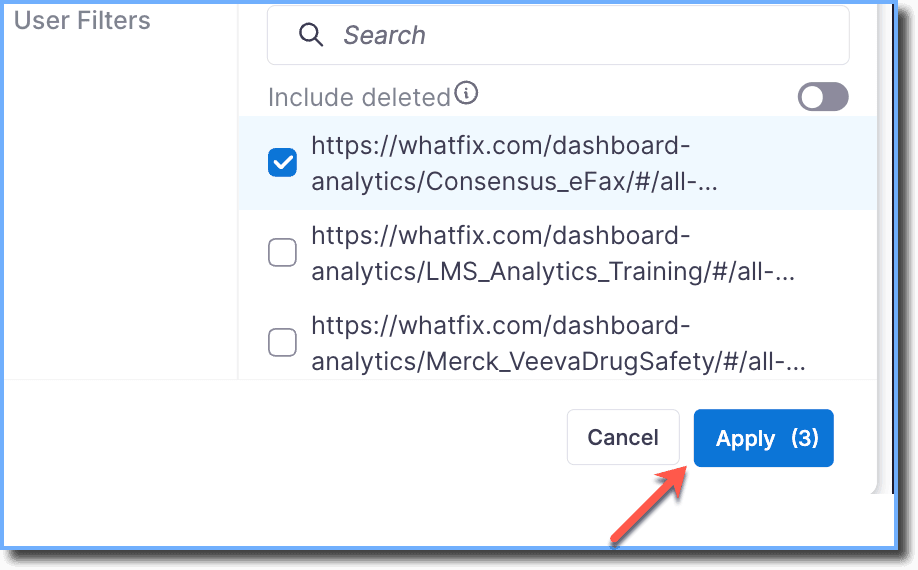
Feedback for the selected page(s) or URL(s) appears. A single user might submit feedback multiple times on a page or across different pages, so the results show all feedback and do not represent unique views.
To know more about Event Groups, Event Filters, and User Filters, see the following articles:
Old vs New Self Help
The Old vs New Self Help Dashboard displays the overall end-user engagement with both the Old and New Self Help. It includes metrics such as the number of times end users opened Self Help, the number of Self Help queries served on a daily basis, the number of times end users accessed content from Self Help, and more.
The following table shows the metrics available on the Old vs New Self Help Dashboard:
| Metric | Description | Event Group | Events Included | Event Filters | User Filters |
|---|---|---|---|---|---|
Old and New Self Help opened by unique users per day 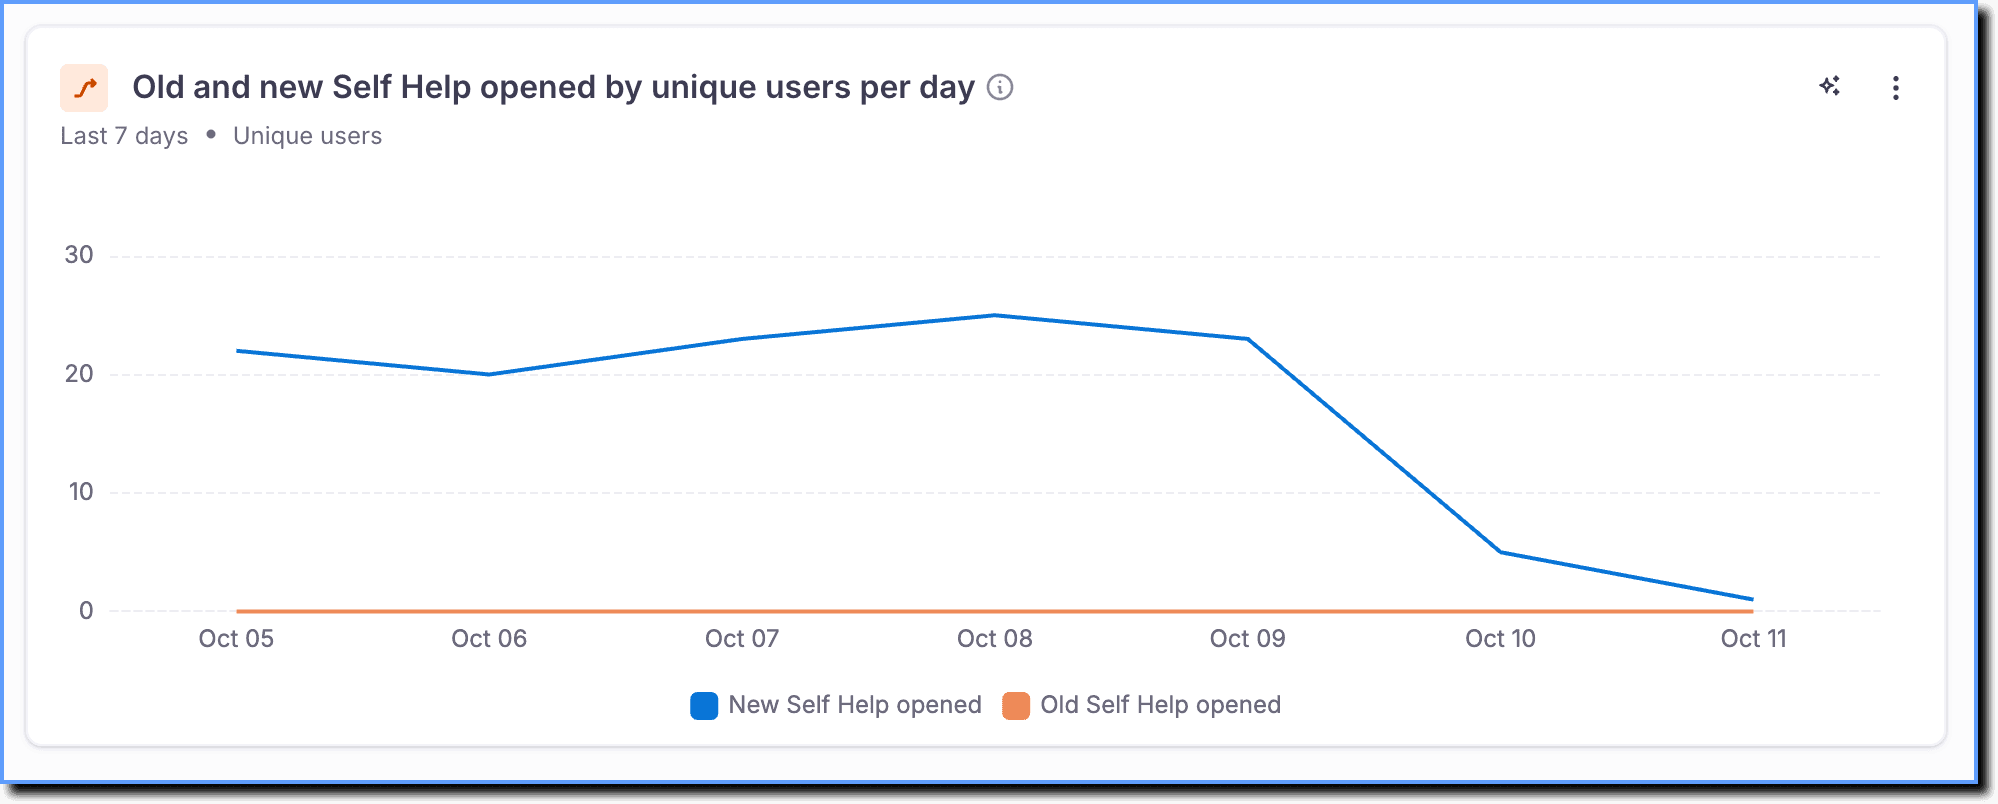 | Displays the total number of unique users opening the Old and New Self Help experiences daily, providing a comparison of end-user engagement for both. | New Self Help opened | - Clicks on Self Help (New) icon of Pin - Clicks on Explorer icon within the Pin on roll over | - Page url - Event Type - Event Trigger Location - device_browser_version | - Device - Location - URL/IP - User - Variables - Uncategorized |
| Old Self Help opened | Self Help Opened | - Segment Name - Event Type - Event Trigger Location - device_browser_version | |||
Old and New Self Help searches by unique users per day 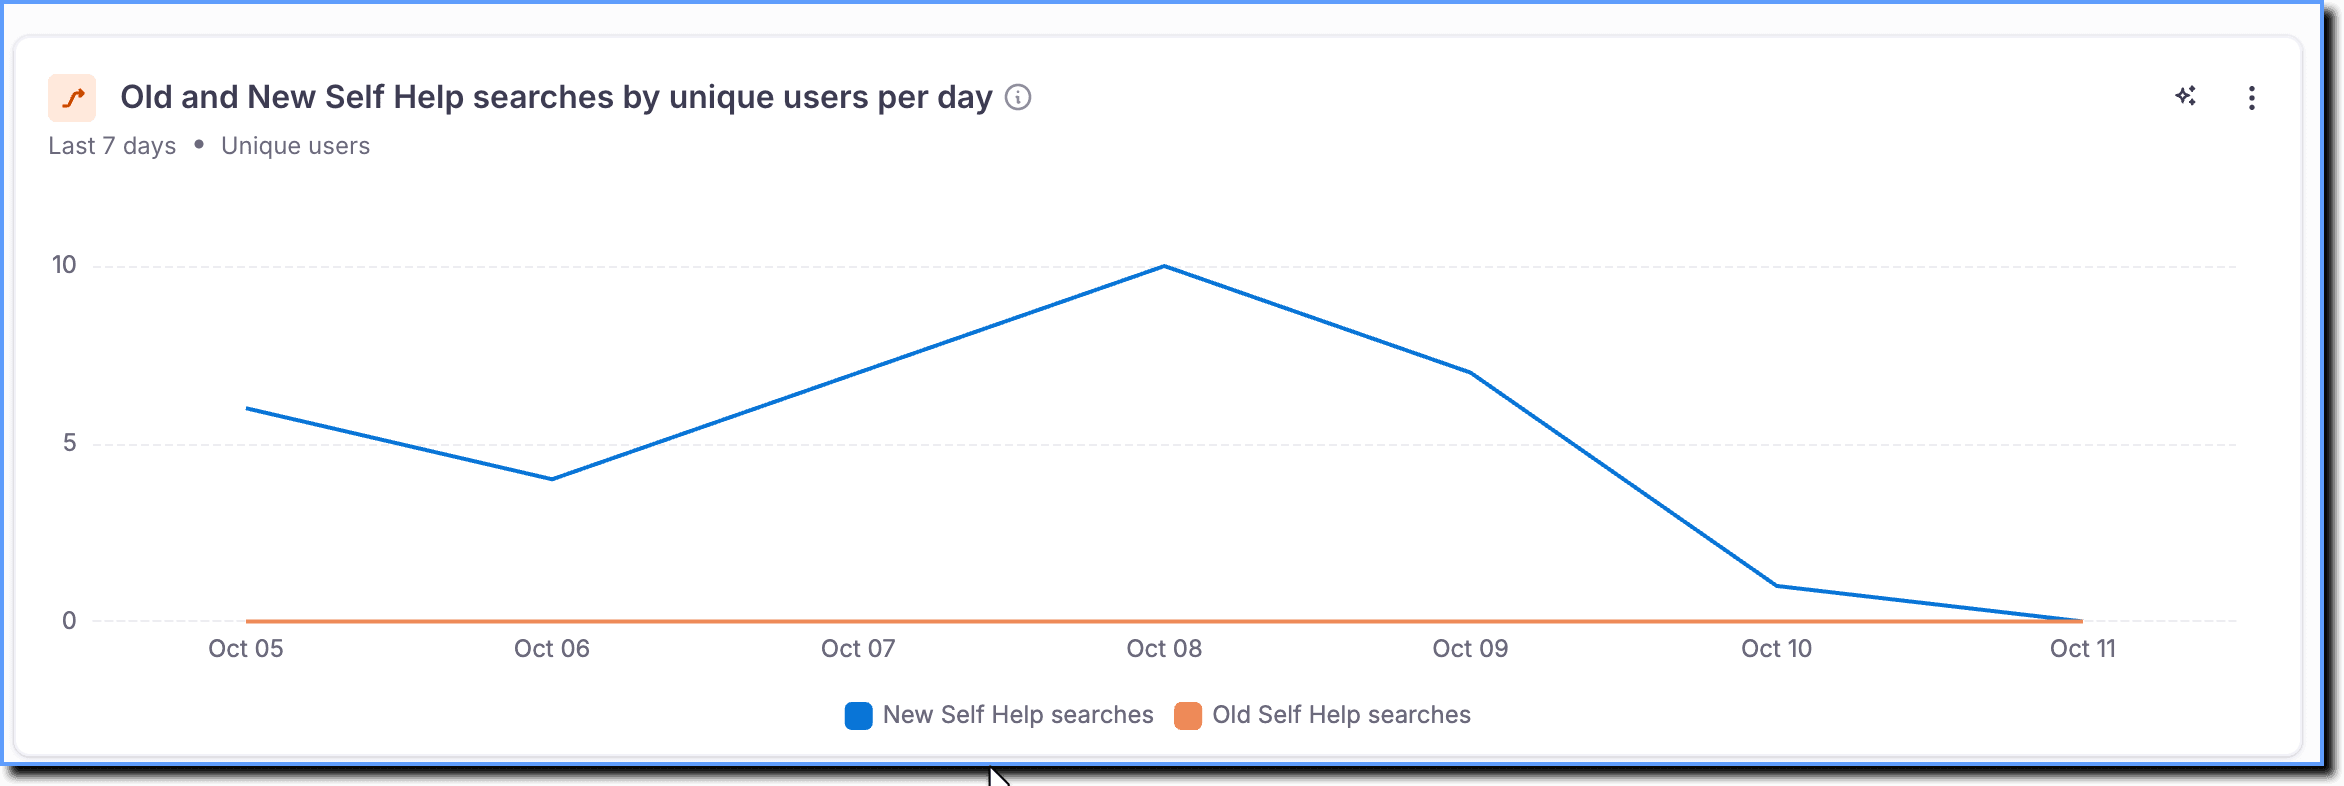 | Displays the total number of unique users searching in the Old and New Self Help experiences daily, providing a comparison of end-user engagement for both. | New Self Help searches | Self Help (New) Explorer | - Search term - Search type - Segment Name - Search success - Filters - Page url - Search time - Event Type - Event Trigger Location - device_browser_version | - Device - Location - URL/IP - User - Variables - Uncategorized |
| Old Self Help searches | Self Help Search | - Segment Name - Search Results - Event Type - Event Trigger Location - device_browser_version - Search Term | |||
Old and New Self Help content consumed by unique users per day 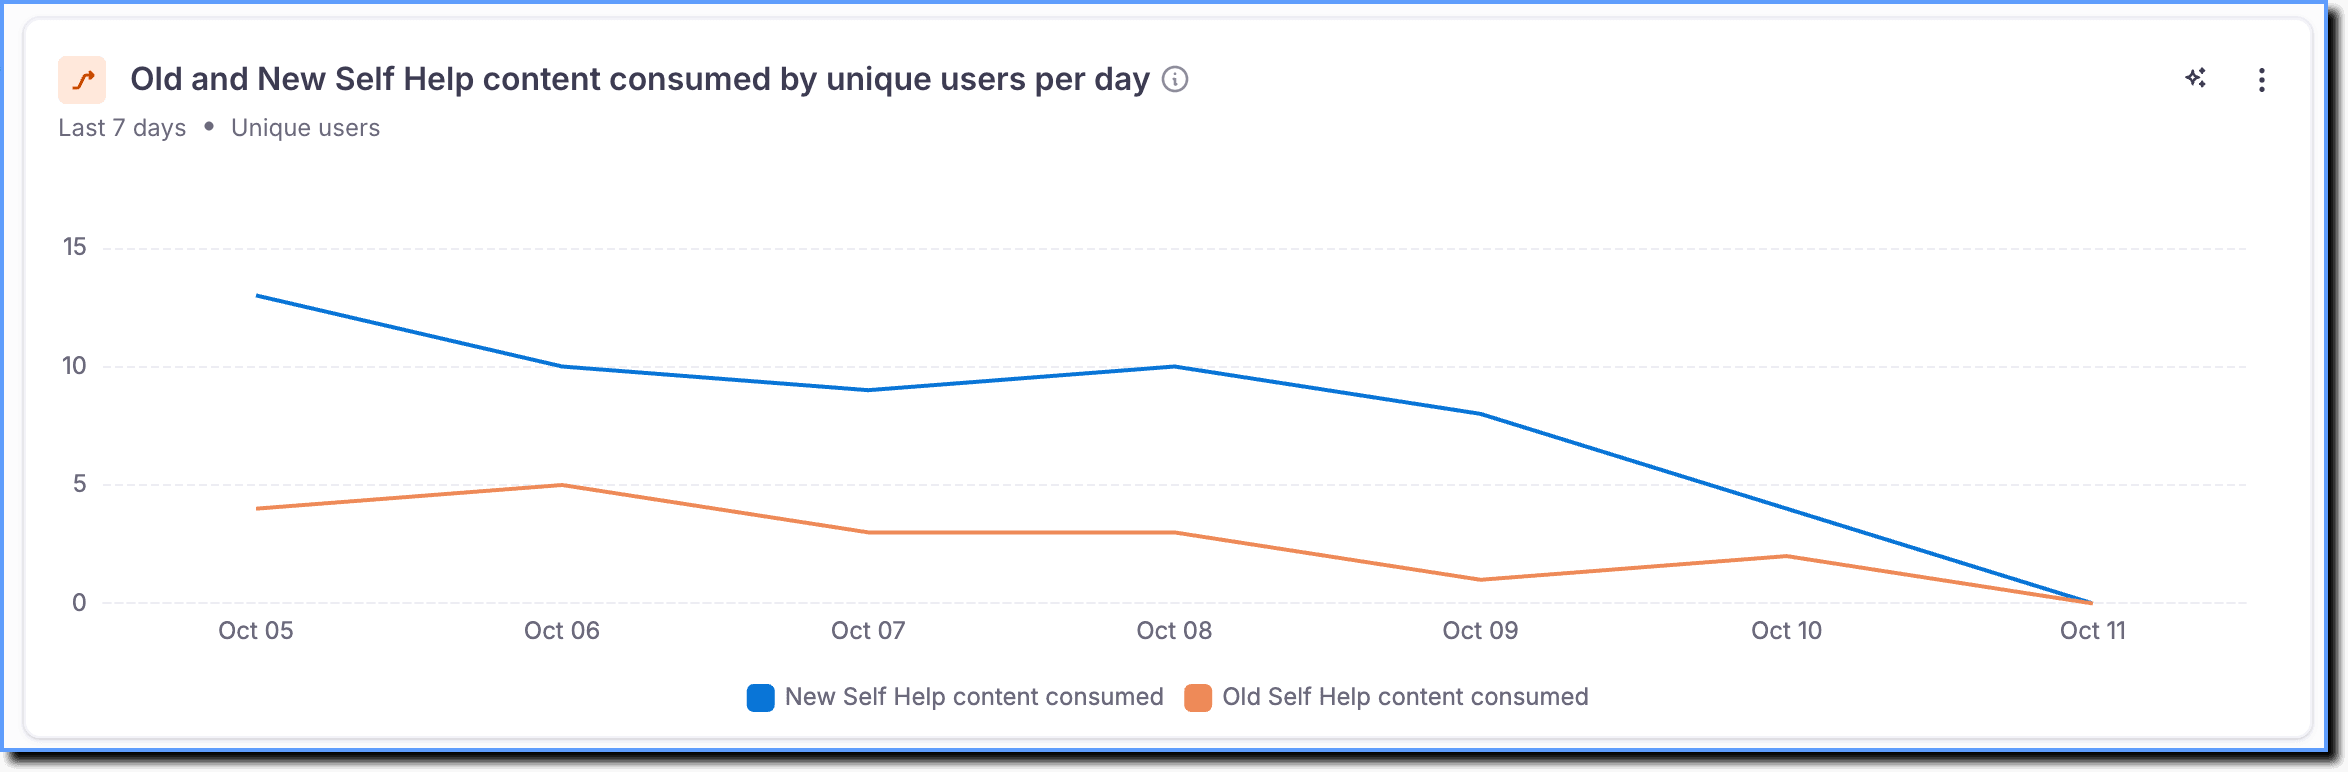 | Displays the total number of unique users consuming content in the Old and New Self Help experiences daily, providing a comparison of end-user engagement for both. | Old Self Help content consumed | - Pdf Viewed - Article Viewed - Flow started - Link opened in new format - Video link clicked - IMAGE_START | - Content Title - Segment Name - Event Type - Event Trigger Location - device_browser_version | - Device - Location - URL/IP - User - Variables - Uncategorized |
| New Self Help content consumed | Clicks on content within Explorer | - Search term - Segment Name - Content Title - Content level - Event Type - Event Trigger Location - device_browser_version - Content type - Search Type |
To know more about Event Groups, Event Filters, and User Filters, see the following articles:
By default, only data from the Production stage is shown. If you want to get data from other stages, you need to configure them on your Whatfix Dashboard. For more information, see Get Analytics Data across CLM Stages. Once you’ve configured the stages in Settings, see How do I get analytics data across CLM stages in the New Guidance Analytics Dashboard experience? to know how to get the data across stages in the new experience.