Analytics
How to visualize Analytics data in your timezone?
Visualize Product analytics data in the timezone of your choice. Viewing analytics data in the correct timezone has the following advantages:
- Improves data accuracy.
- Helps understand user behavior better if the data aligns with their local time.
Info
- The timezone setting applies only to analytics data and not to other features in the account.
- The timezone setting applies at the account level.
Use the following steps to set the timezone to visualize analytics data:
-
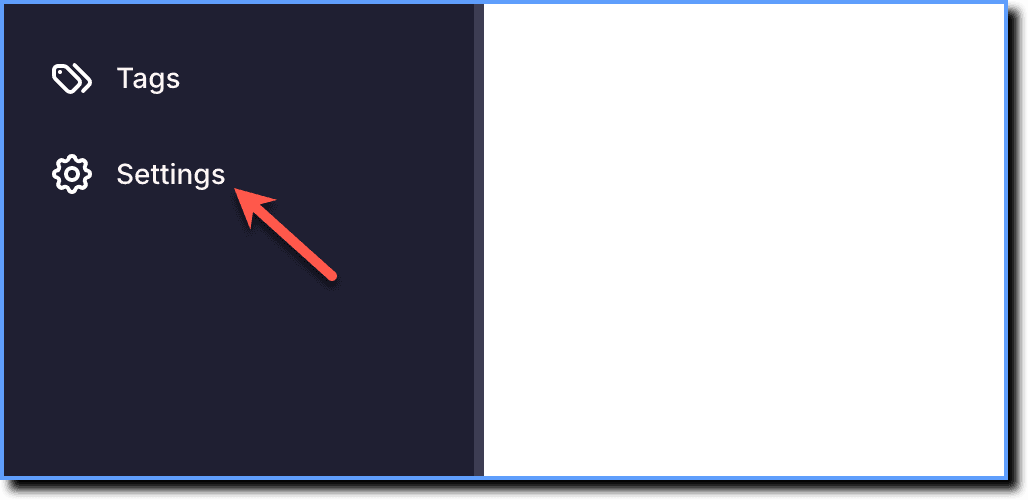
On the Whatfix Guidance dashboard, click Settings.
-
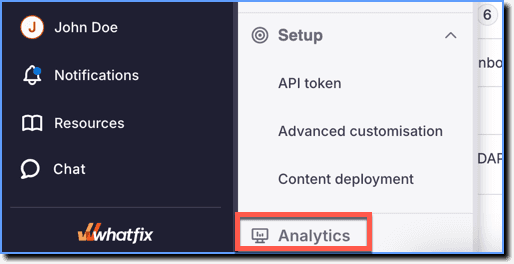
Click Analytics.
-
Scroll down on the Analytics page and then select the required timezone from the dropdown.

-
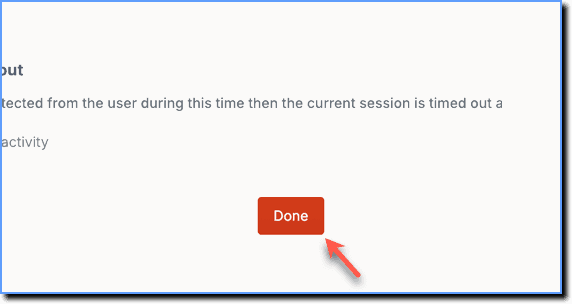
Click Done.
Info
- By default, the analytics data is shown in the GMT+5:30 timezone.
- After setting the preferred timezone, the following image illustrates the visualization in Guidance Analytics.

- The following GIF illustrates the visualization in Product Analytics.
