Insights
How can I exclude blank filter values from event analysis?
There might be instances when Whatfix is unable to capture the city or country value and it appears as a blank (-) in the Insights data.
Whatfix enables you to exclude such blank values from Event filters and User filters in Trend Insights, and User filters in Funnel Insights and User Journey, to ensure accurate data. 
- Blank values might appear in your data due to the following reasons:
a. Late configuration of filters: User filters, such as User Attributes, might have been configured mid-way and not from the beginning. Hence there might be blank values from the time period when the data is not captured. For example, if Whatfix was deployed on January 1 but the User Attribute is configured only on January 30, data from January 1 to 29 won’t have the attribute value, resulting in blanks.
b. Configuration issues: If there are issues with the configuration of certain filters, such as User Attributes, blank values might appear in the data.
c. Unavailable values during data capture: If a filter value is not available in the application when the engagement data is captured, blank values might appear in the data.
- Currently, Whatfix does not support the exclusion of blank filter values in Event groups, Cohorts, and Dashboards.
Use case
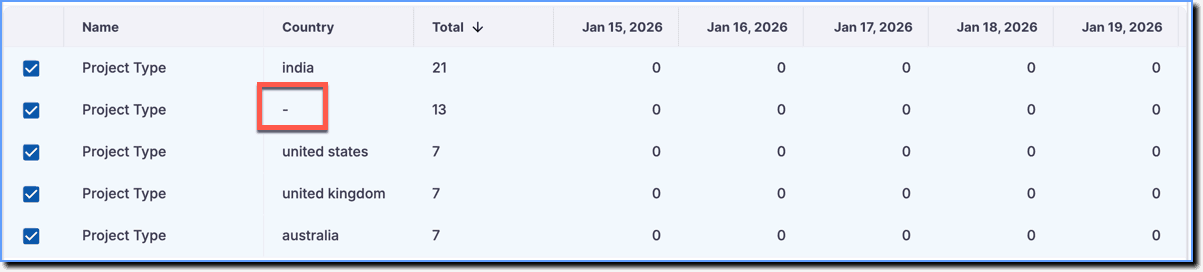
Analyze the number of users who engaged with a feature from any country without blank values.
Data before excluding blank value:
Data setup:
Event metric: Total events
Event: App event = Project Type
User filter: Country Does not equal to Blank(-)
User breakdown: Country
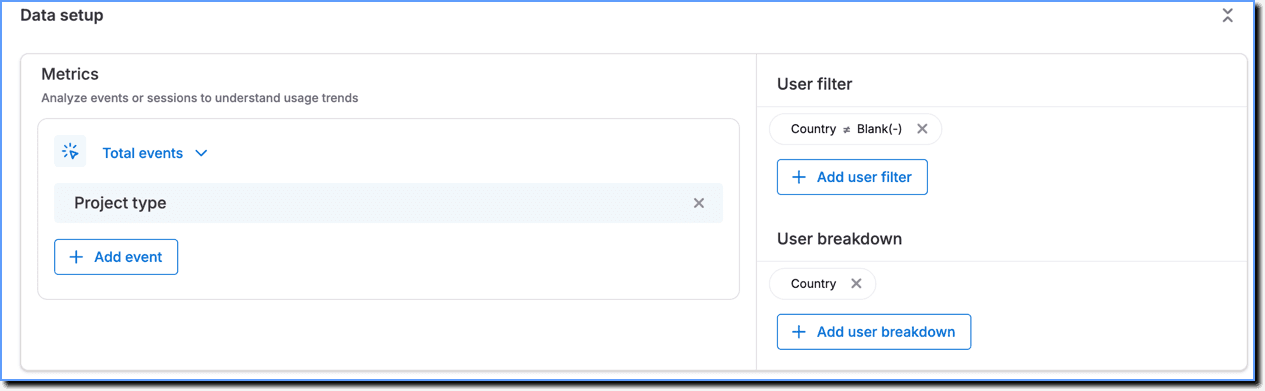
Data after excluding the blank value:

Use the following steps to exclude blank values in event analysis:
The following steps show how to exclude blank values in Trend Insights. The process is similar for Funnel Insights and User Journey.
-
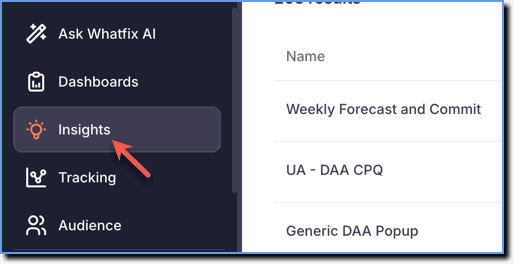
On the Whatfix Analytics dashboard, click Insights.
-
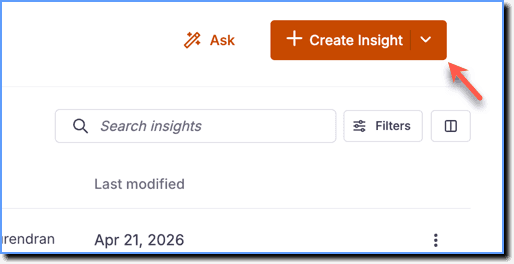
Click Create Insight.
-
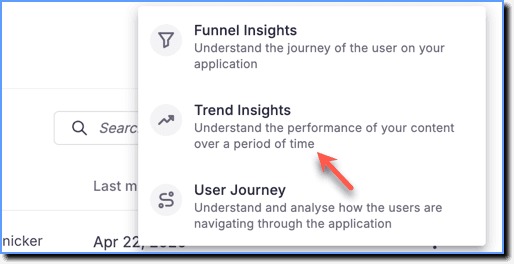
Click Trend Insights.
-
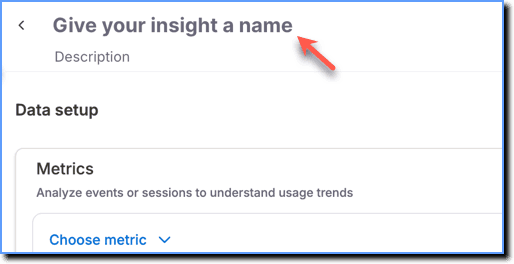
Click the Give your insight a name textbox and enter a name for your Insight.
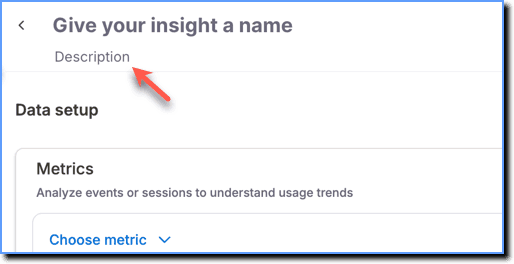
 2. Click the Description text box and enter a description that explains what the Trend Insight is about.
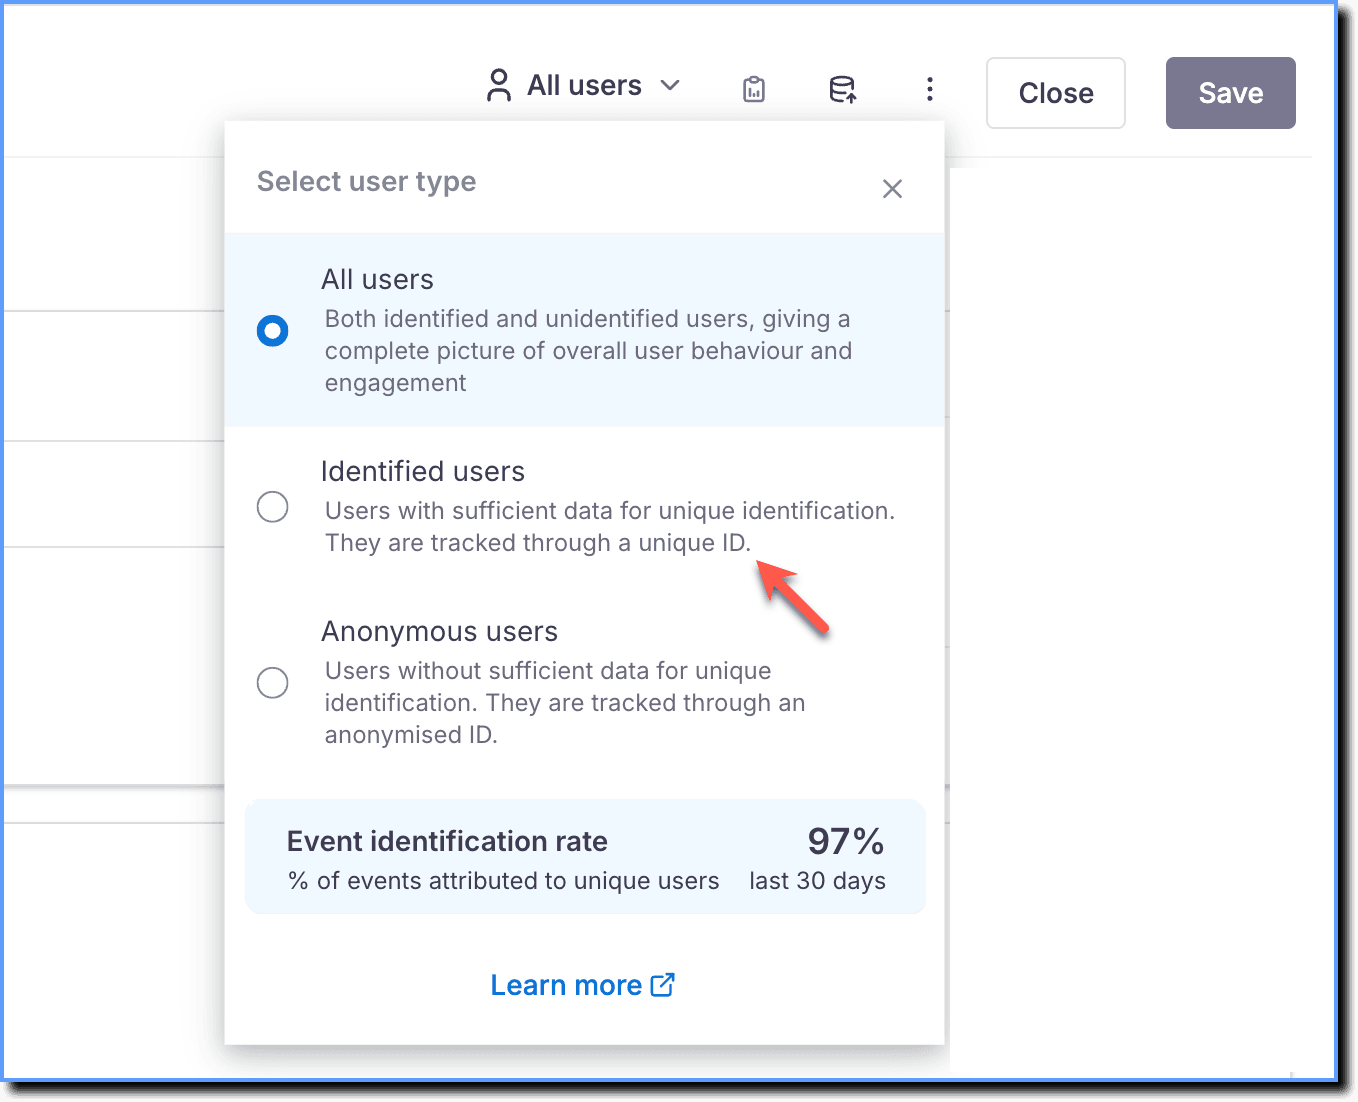
 3. From the Select user type dropdown, choose whether to analyze data for All users, Identified users, or Anonymous users.
Note:
- By default, Insights data might contain identified (users identified by User ID) and unidentified (users not identified but denoted by Anonymized Whatfix IDs) users.
- The Event identification rate indicates the percentage of events Whatfix is able to attribute to uniquely identified users.
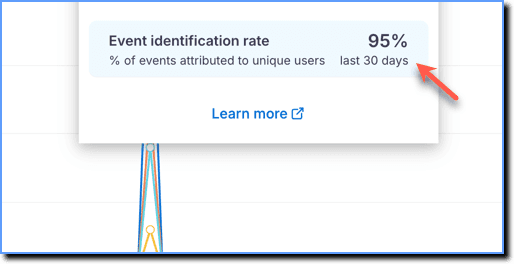
- For more information on filtering users and understanding the Event identification rate, see How can I filter unidentified users in Insights?
- Click the Data source icon and select the stage from which you want to get the data.
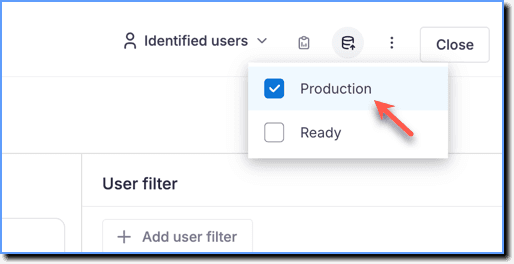 5. Click Choose metric.
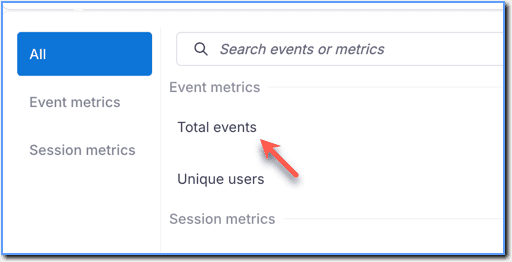
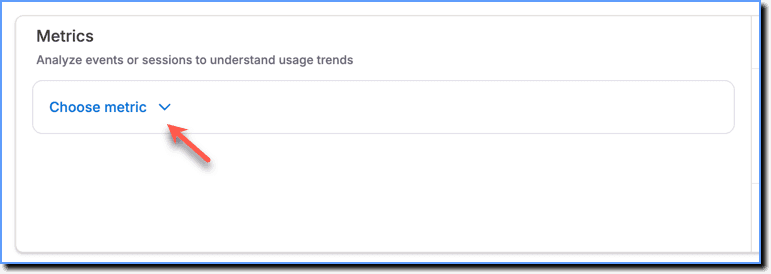 6. Under Event metrics, select Total events or Unique users as required.
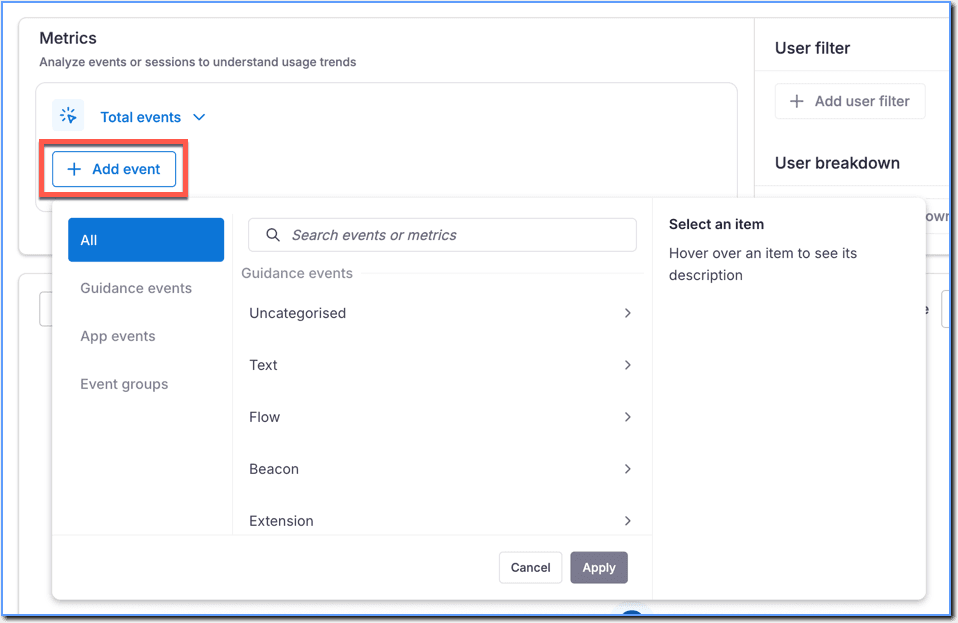
 7. Click Add event and then add the required Guidance events, App events, or Event groups.
 8. Add the required Filter or Breakdown for the event.
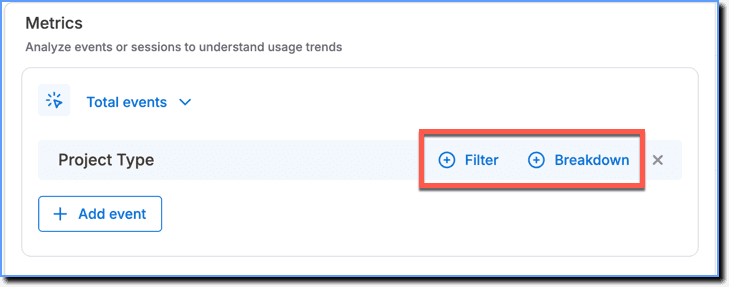
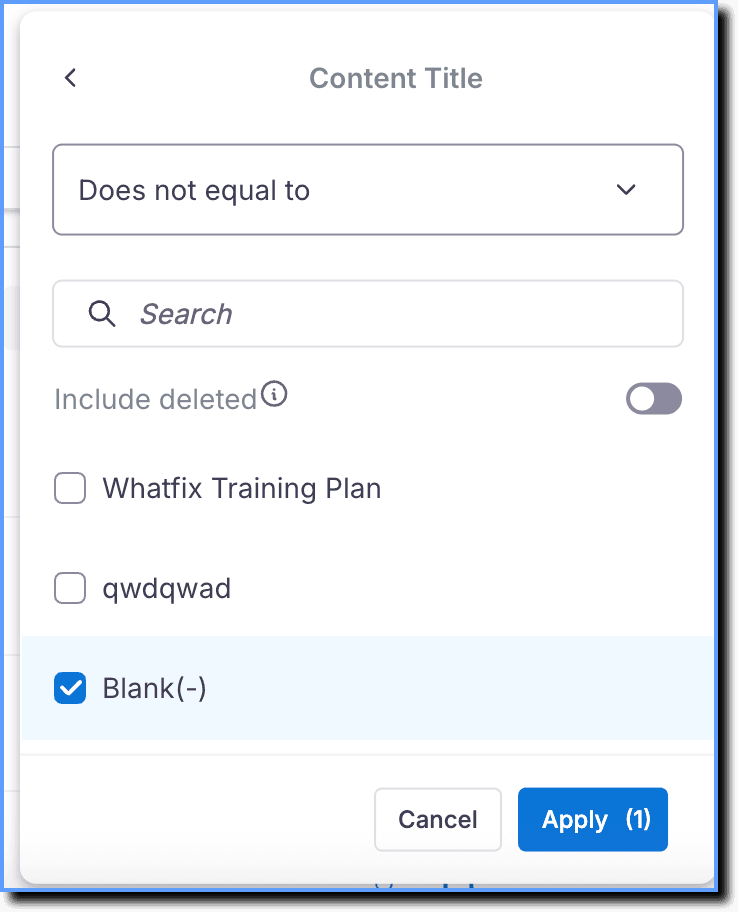
Whatfix enables you to exclude blank values in Event filters. Ensure that you add the Does not equal to condition to remove blank values. This is applicable only for Trend Insights.
- In the User filter section, click Add user filter and then select the desired filter.
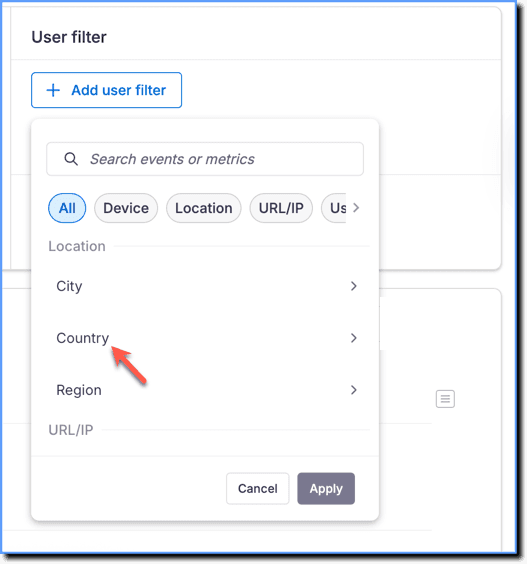
The country filter contains blank values. Here’s how the data looks like before the blank values are excluded.
- Select Does not equal to from the dropdown.
 11. Search for blank.
 12. Select Blank(-), and then click Apply.
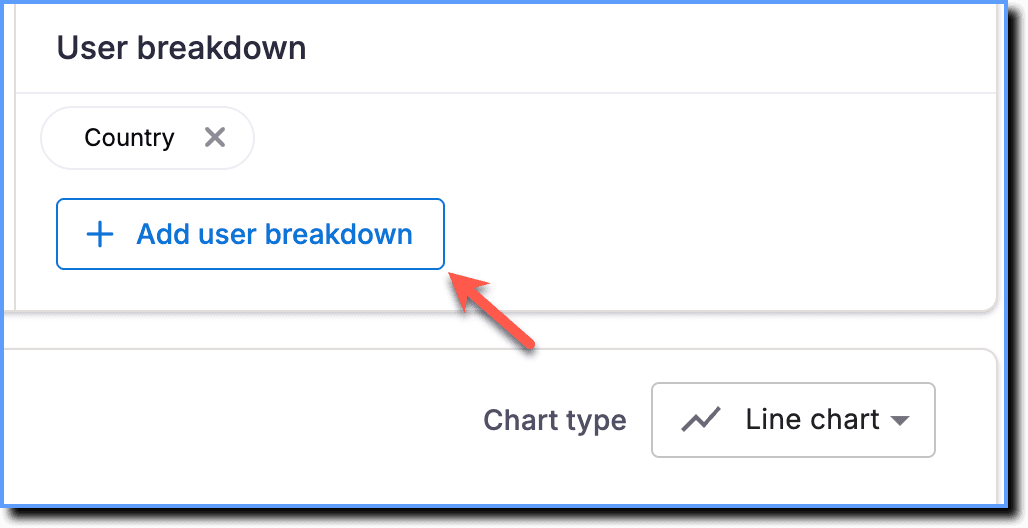
 13. In the User breakdown section, click Add user breakdown, and then select the desired breakdown. In this example, Country is selected.
 14. Select the Chart type as Table to visualize the data.
 15. Scroll down to view the generated data chart. The blank values are excluded from the data.
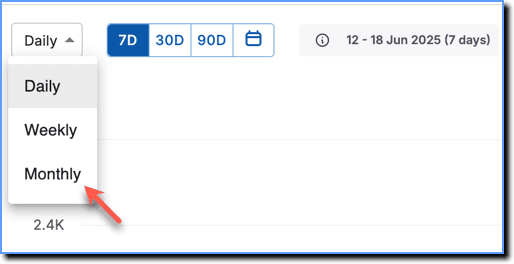
Filter data based on Daily, Weekly, or Monthly timeframes.
- Click Save.
Shows overall behavior and engagement for both identified and anonymous (unidentified) users.
Users that Whatfix can detect and identify using a unique User ID.
Users that Whatfix cannot identify. These users are denoted by the Anonymized Whatfix IDs rather than an actual User ID.
The total number of times the event occurred.
The number of unique users who triggered the event.
Guidance events include all events triggered when end users interact with Whatfix content or widgets within the application.
App events include engagement with User Actions, Autocaptured events (Beta), or events captured using the Whatfix API.
An Event group combines two or more individual events into a single grouped-event. It enables you to see the total number of users who performed any of the events in the group.