Dashboards
Create Custom Dashboards in Analytics
Dashboards help you visualize your data and help with reporting. Add contextual Trend Insights, Funnel Insights, User Journeys, or Ask Whatfix AI-generated insights to your dashboards. Create and customize dashboards based on your business needs and use cases.
Use the following steps to create Custom Dashboards:
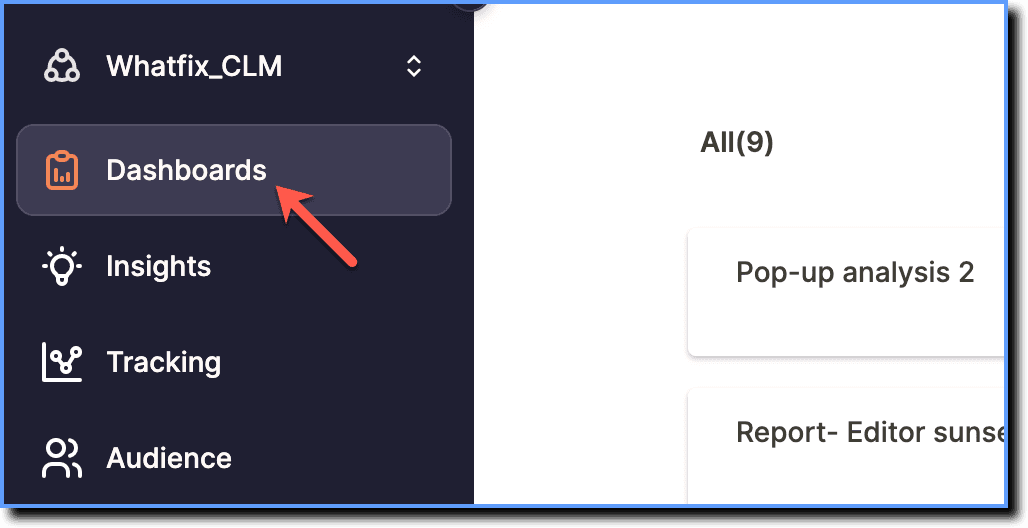
- On the Whatfix Analytics dashboard, click Dashboards.
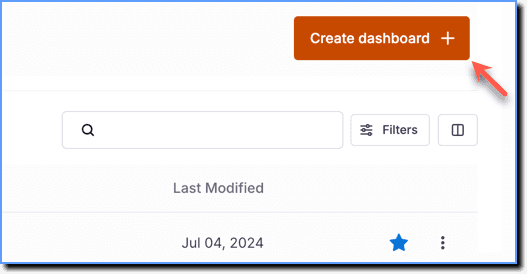
- In Dashboards section, Go to the top-right, and then click Create Dashboard.
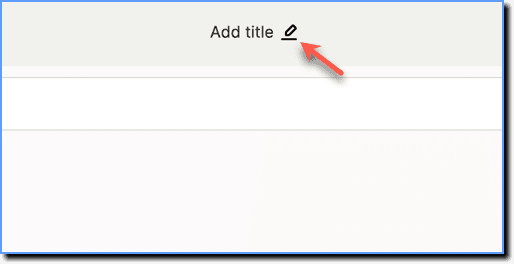
- Click the edit icon on Add title to add a description for the Dashboard.
Info:
- The maximum character limit for the name of the Dashboard is 200 characters. Special characters and spaces are supported.
- The maximum character limit for the Description is 500 characters. Special characters and spaces are supported.
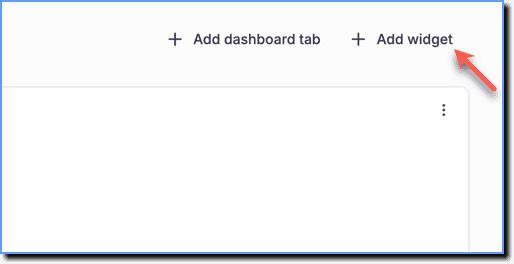
- Click Add widget.
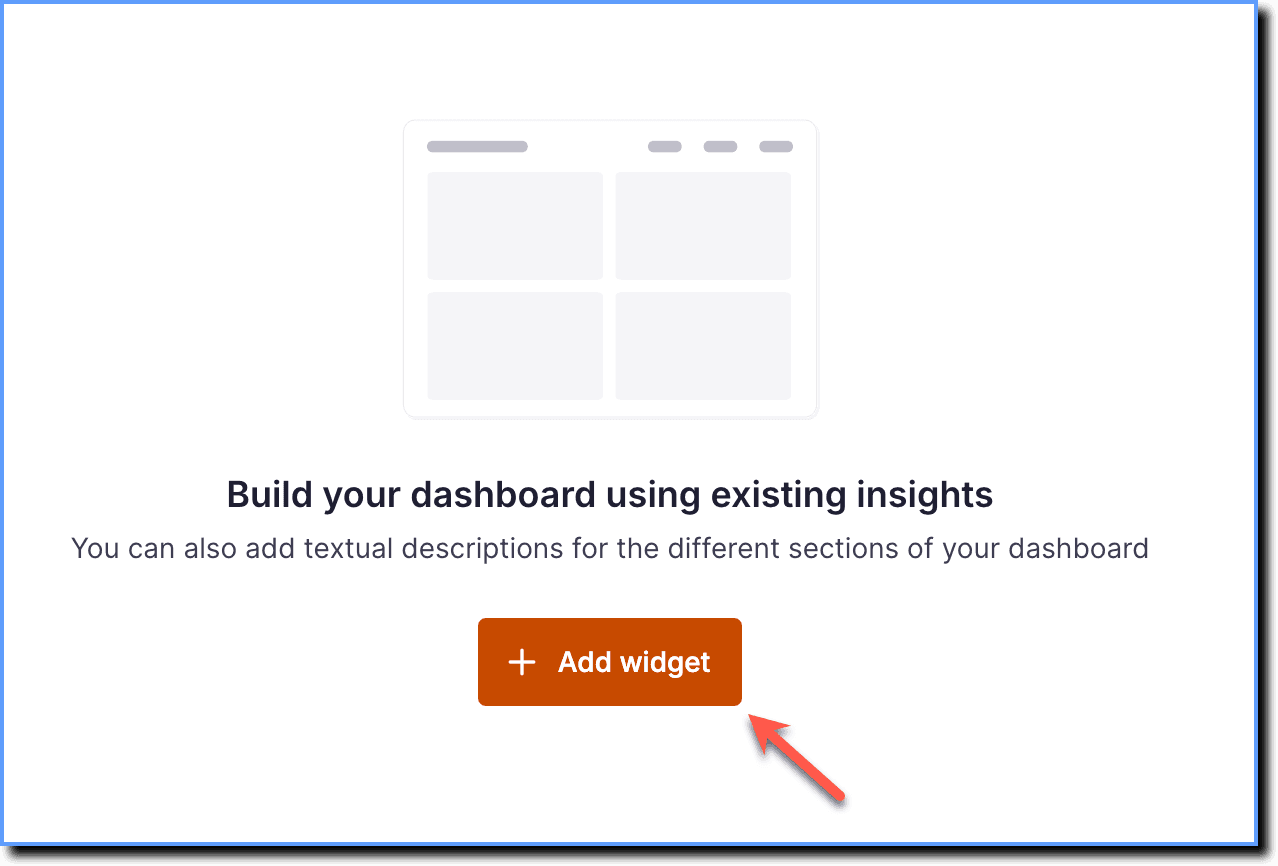
Info:
Widget refers to the components you can add to a Dashboard. Currently, Whatfix enables you to add Insights and text as widgets.
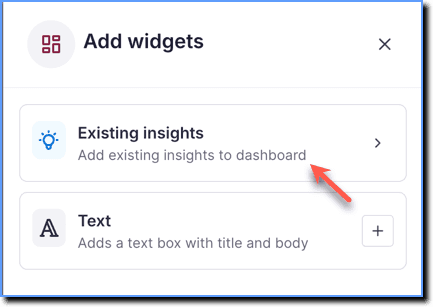
- In the Add widgets drawer, click Existing insights.
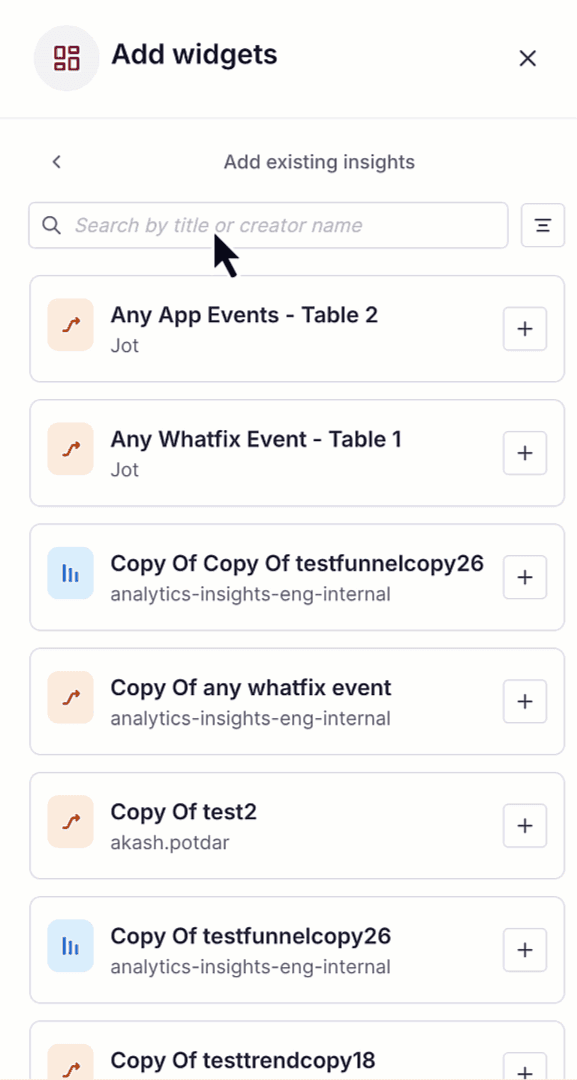
- Hover your cursor over the insight or search for the insight you want to add, and then click the Add insight icon.
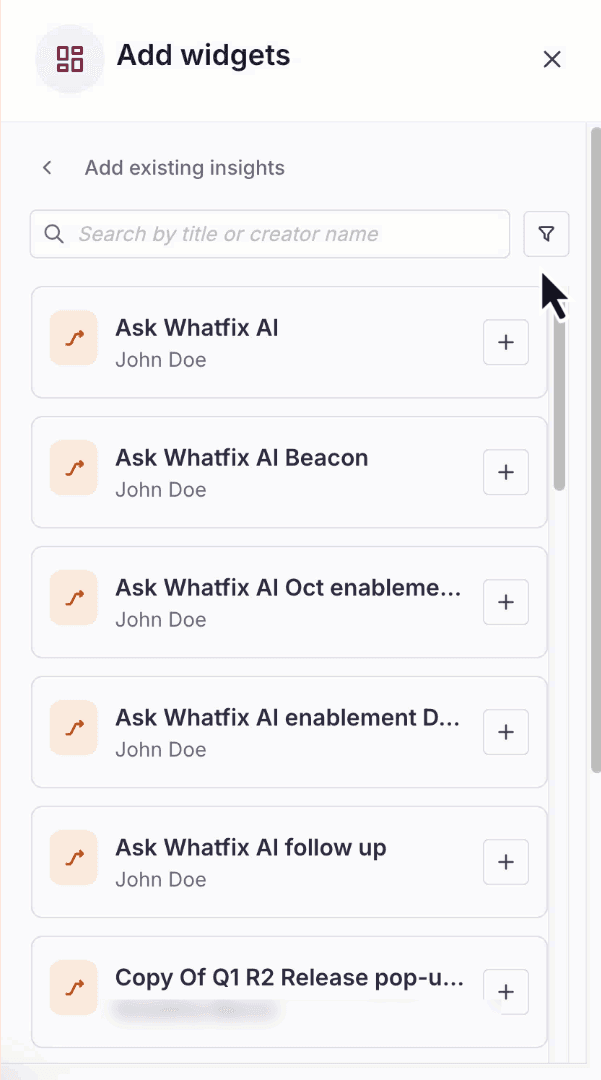
Info:
Access Insights you want to add to the Dashboard by filtering them based on Creators and Insights Type. The insight gets added to the Dashboard.
- Click Add widget and then follow Steps 5 and 6 to add more number of Insights.
Info:
- Alternatively, hover your cursor over the widget (Insight or text), and then click the Add widget icon on the resizing bar to add a new widget.
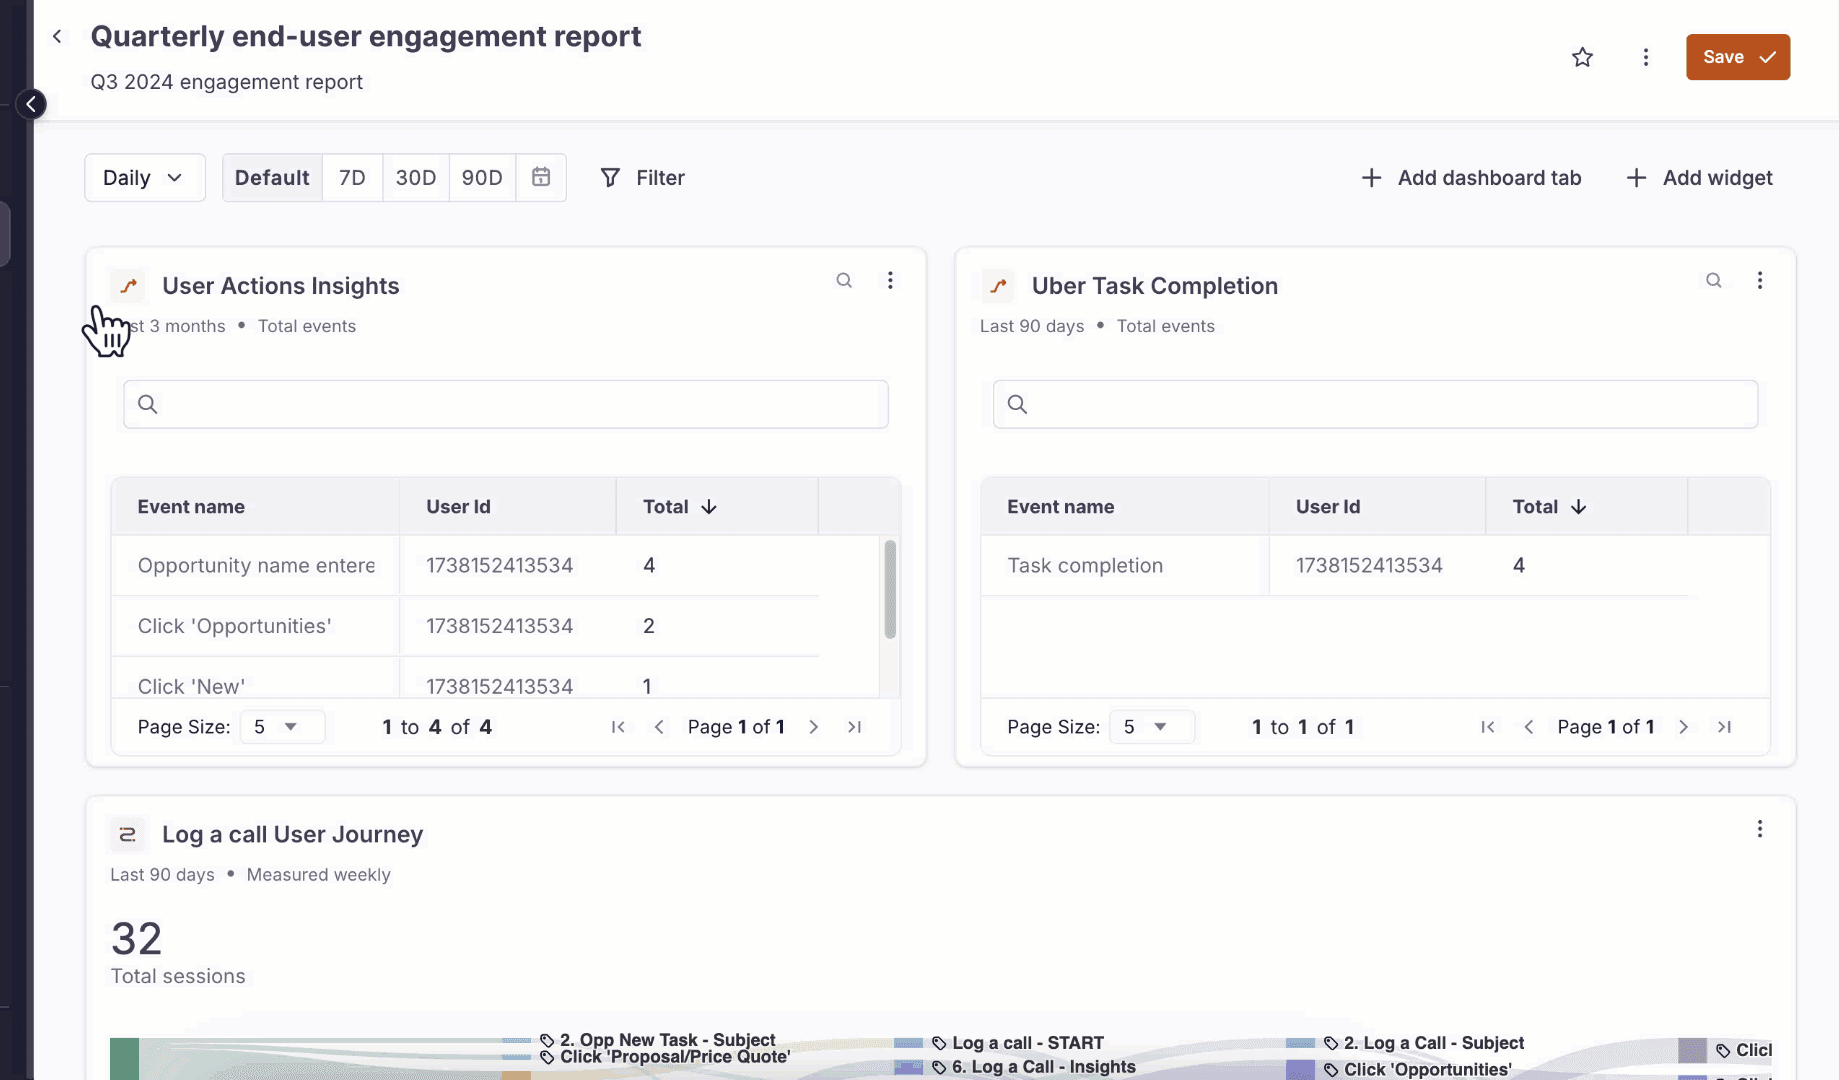
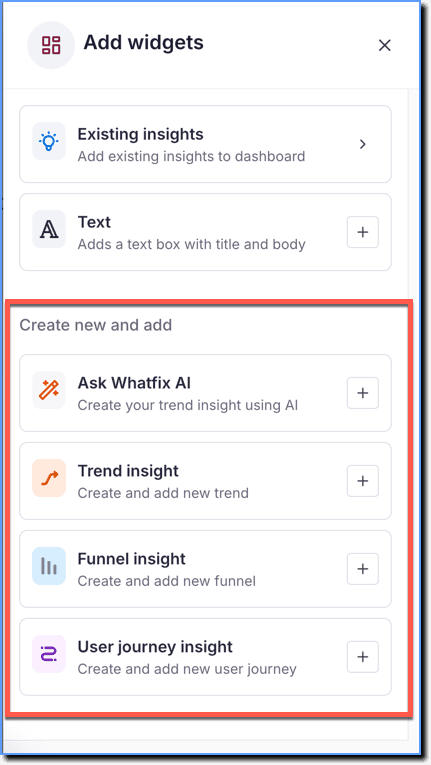
- Whatfix enables you to use Ask Whatfix AI to automatically generate Trend or Funnel Insights while creating or editing a Dashboard and add the generated Insight to the Dashboard.
- Create and add a new Insight (Trend insight, Funnel insight, or User journey) while creating or editing a Dashboard.
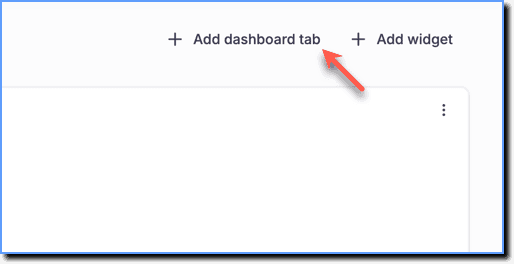
- Whatfix enables you to create multiple tabs in a particular Dashboard and organize Insights better. For more information, see Add tabs in a Custom Dashboard.
- Click Add widget, and then click Text.
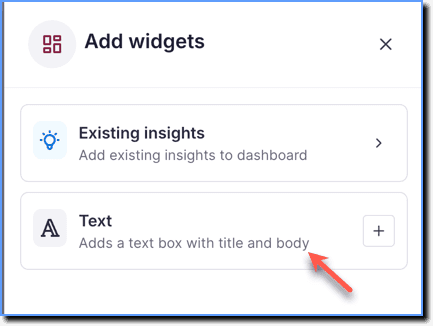
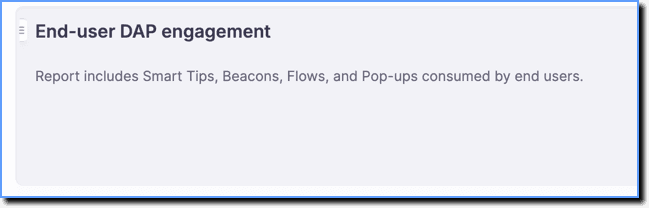
- Enter a text and description for the insight.
Info:
- Add up to 20 Insights to a particular Dashboard, including new Insights created during the Dashboard creation.
- Whatfix enables you to add the same insight multiple times.
- There is no limit on the number of text widgets you can add to a Dashboard.
Note:
-
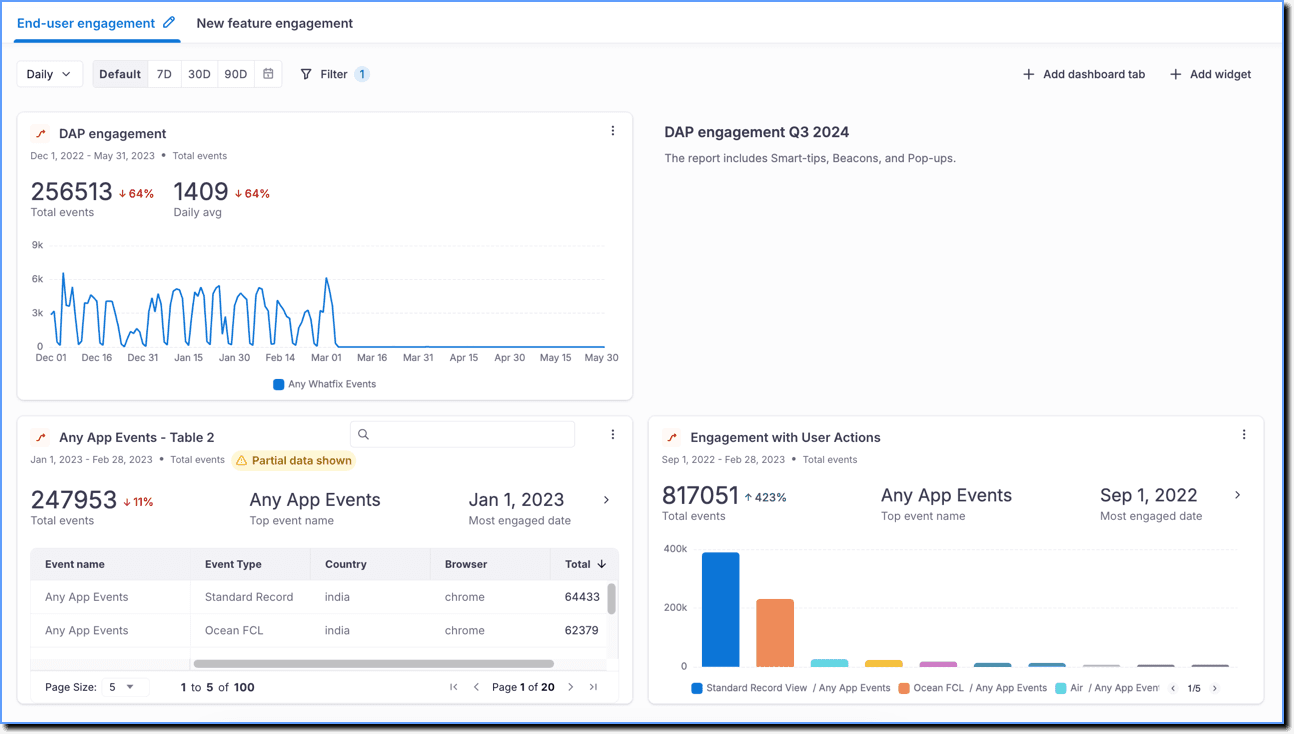
Insights appear on the grid.
-
By default, Insights load with the same data chart in which they are stored.
-
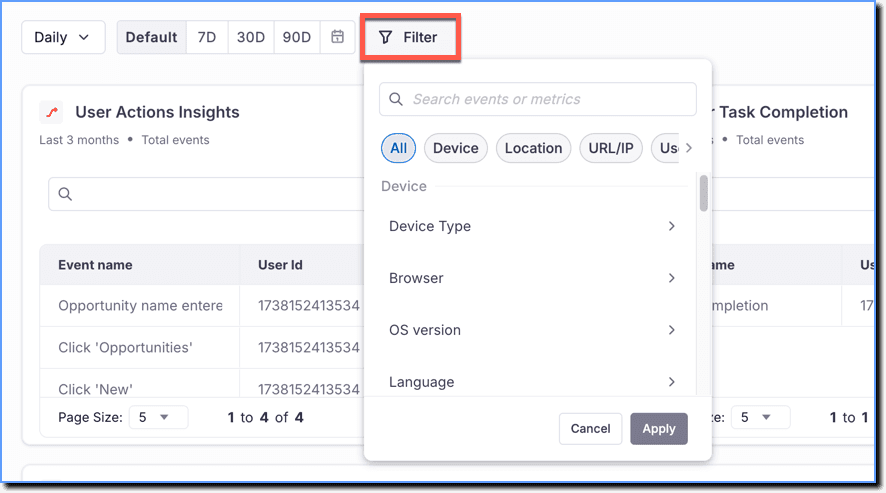
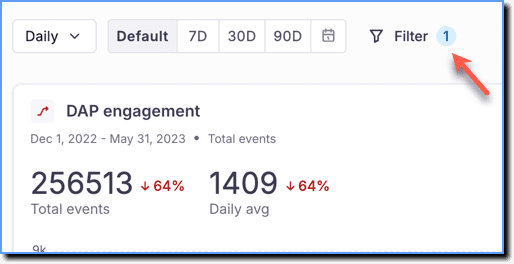
Click Filter to filter the Dashboards based on browser, country, and more. To filter data according to specific conditions, see Use Filters in Dashboards.
-
The badge indicates the number of filters added to the Dashboard.
Info:
-
To exclude specific filter values for which you don't require data, see How can I exclude filter values in Product Analytics?
-
To exclude blank filter values from your data, see How can I exclude blank filter values in Insights?
- Click Save.
Info:
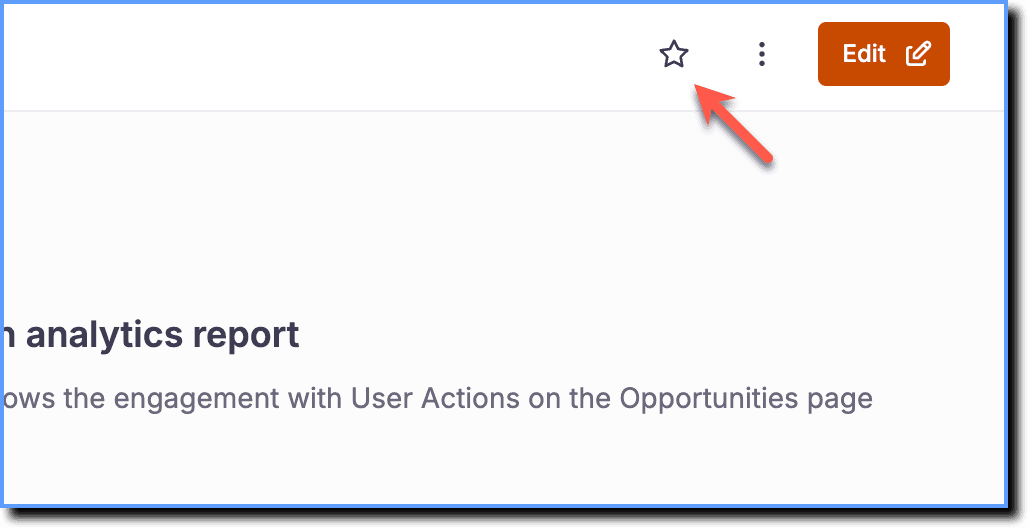
- Click the Star icon to mark your Dashboard as favorite. Favorite Dashboards appear at the top of the list view, making them easier to access.
- Filter data based on Daily, Weekly, and Monthly timeframes.
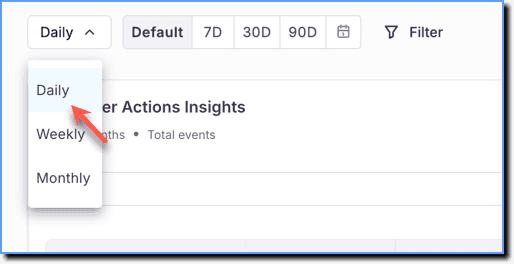
- Click Default to view the Insights within the Dashboard loaded with the same date range in which they are stored.
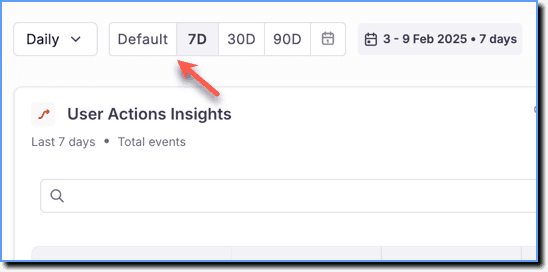
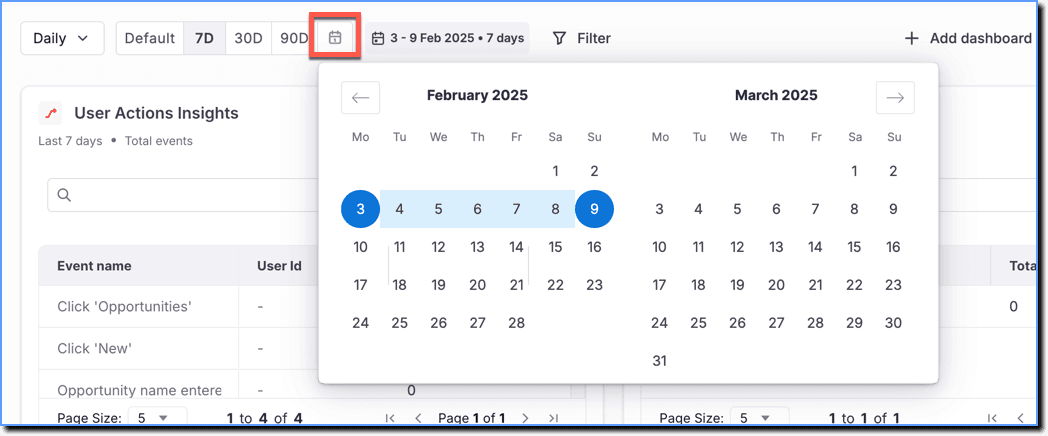
- Click the Calendar icon to set a custom date range.