Whatfix Guidance Analytics for DAP on OS
Analytics Summary
The Summary view in Whatfix Guidance Analytics gives you a high-level overview of DAP on OS performance.
Use the following steps to access your Analytics Summary page:
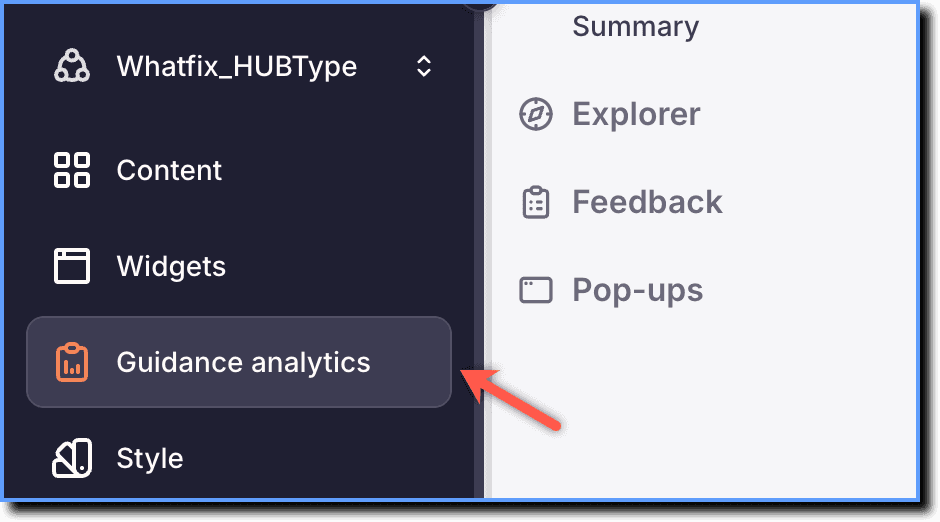
- On the Whatfix DAP on OS Dashboard, click Guidance analytics.
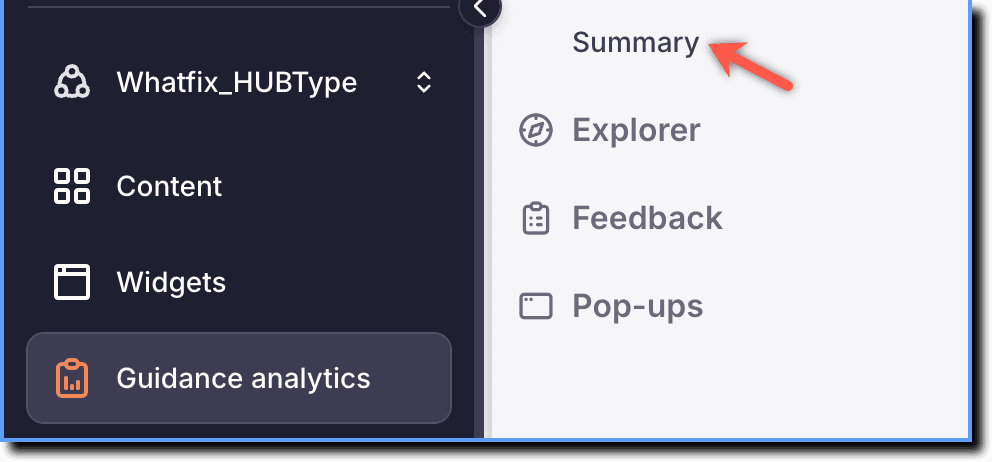
- Click Summary.
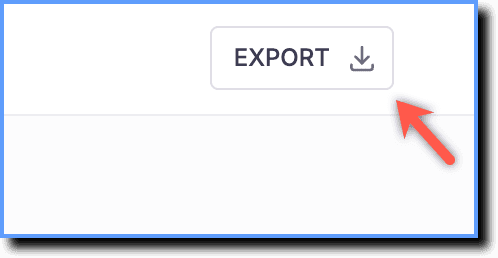
- Click Export to download the report.
The Summary page displays the user and widget engagement data as shown in the following image. 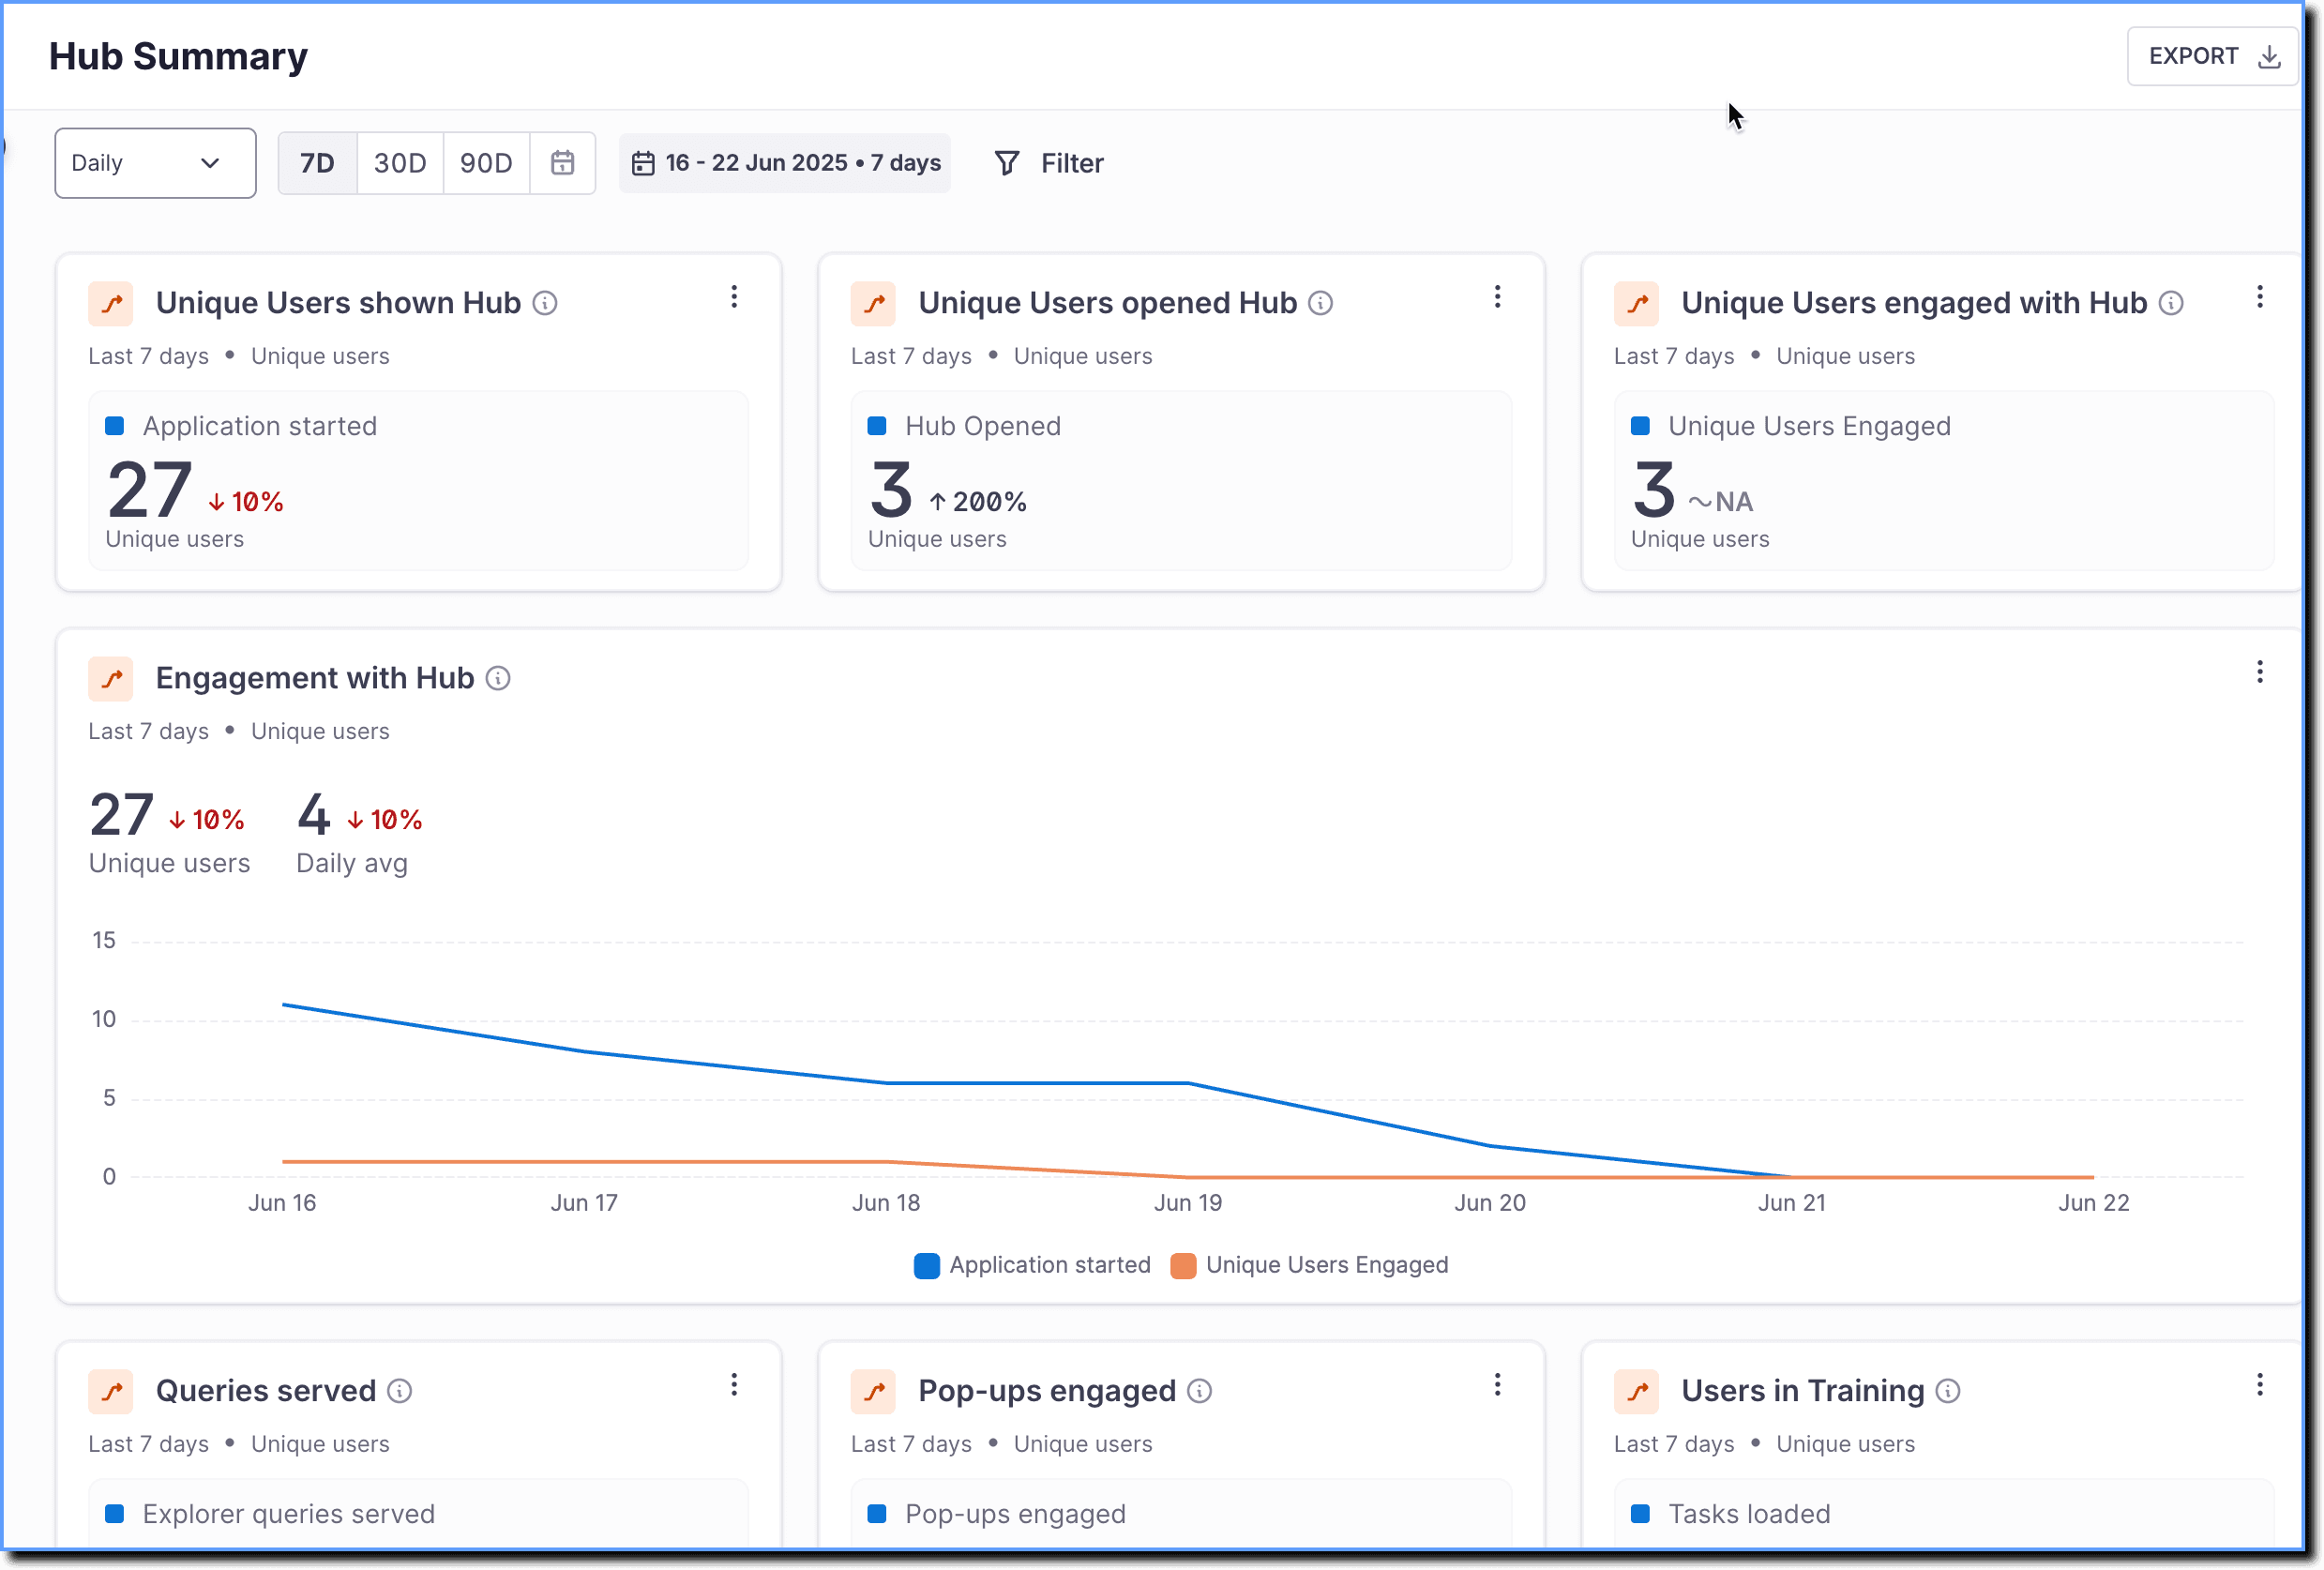
DAP on OS Metrics Explained
| Metric | Description |
|---|---|
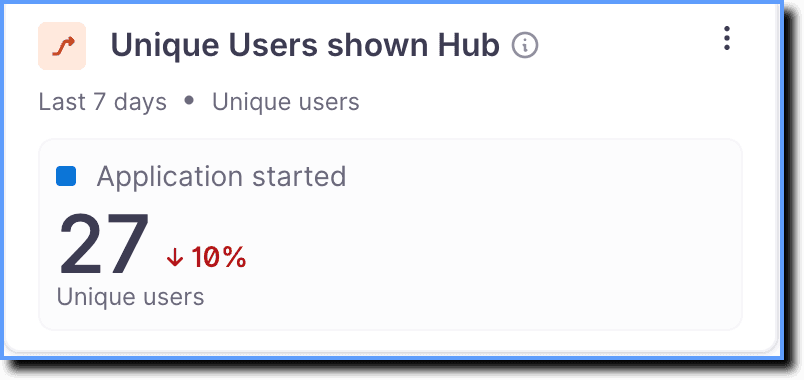 | Unique Users shown Hub: Total number of unique users who have viewed the Hub app at least once. |
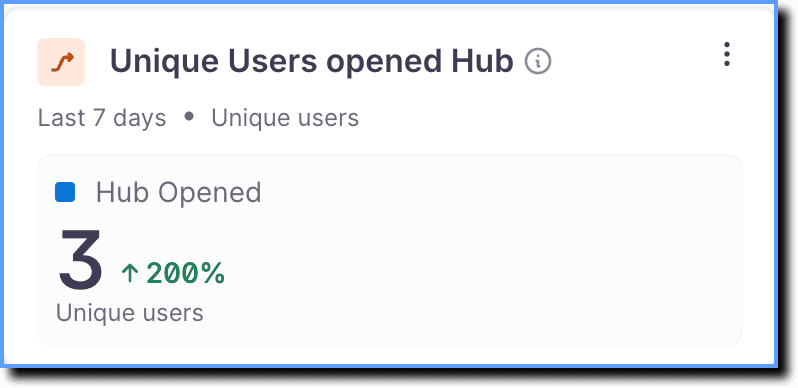 | Unique Users opened Hub: Total number of unique users who have opened the Hub app. |
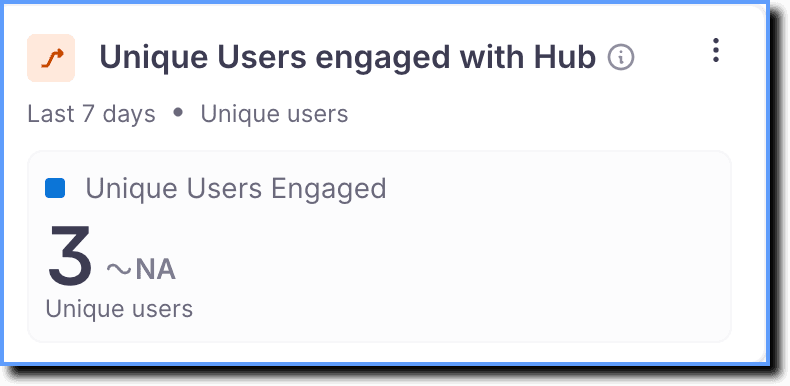 | Unique Users Engaged with Hub: Total number of unique users who engaged with the Hub through button clicks, search bar, checkbox, and more. |
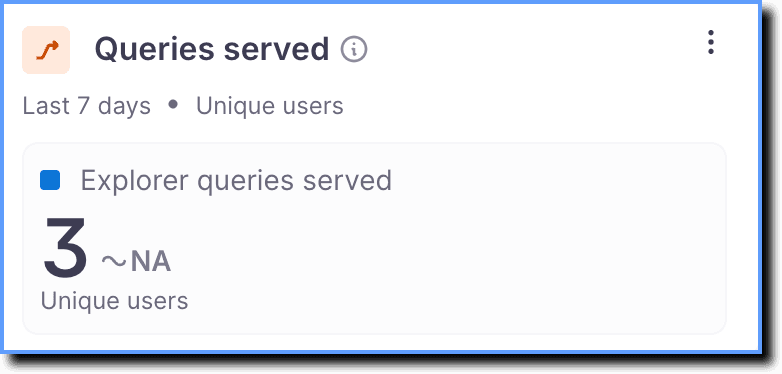 | Queries served: The number of times content was clicked and viewed in Explorer. |
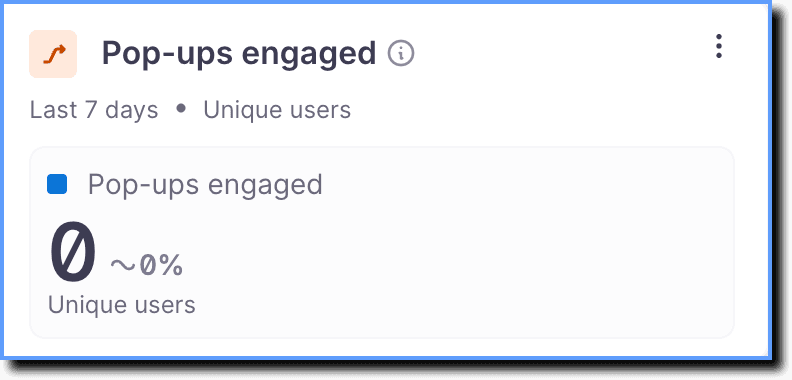 | Pop-ups engaged : Total number of interactions done through Pop-up CTA buttons such as accessing a URL and launching a Flow. |
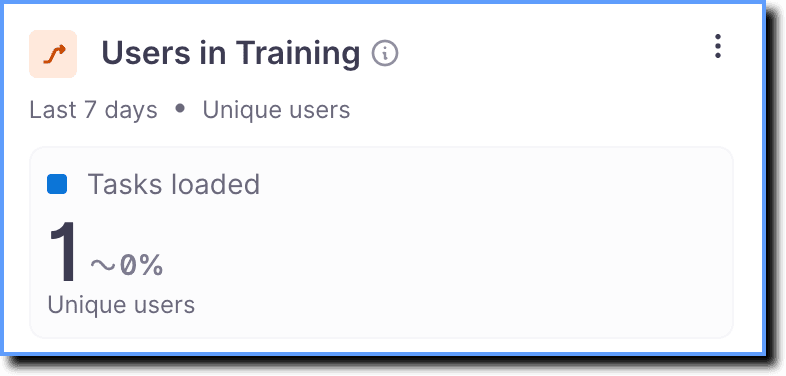 | Users in Training: The number of users to whom Tasks were shown, but they have not completed all the tasks in the Task List. |
Engagement with Whatfix
The chart displays how many users saw the content. Engagement is defined as every user who has had the opportunity to perform an action on Whatfix.
Hover your cursor over each peak to view additional engagement at a more granular level.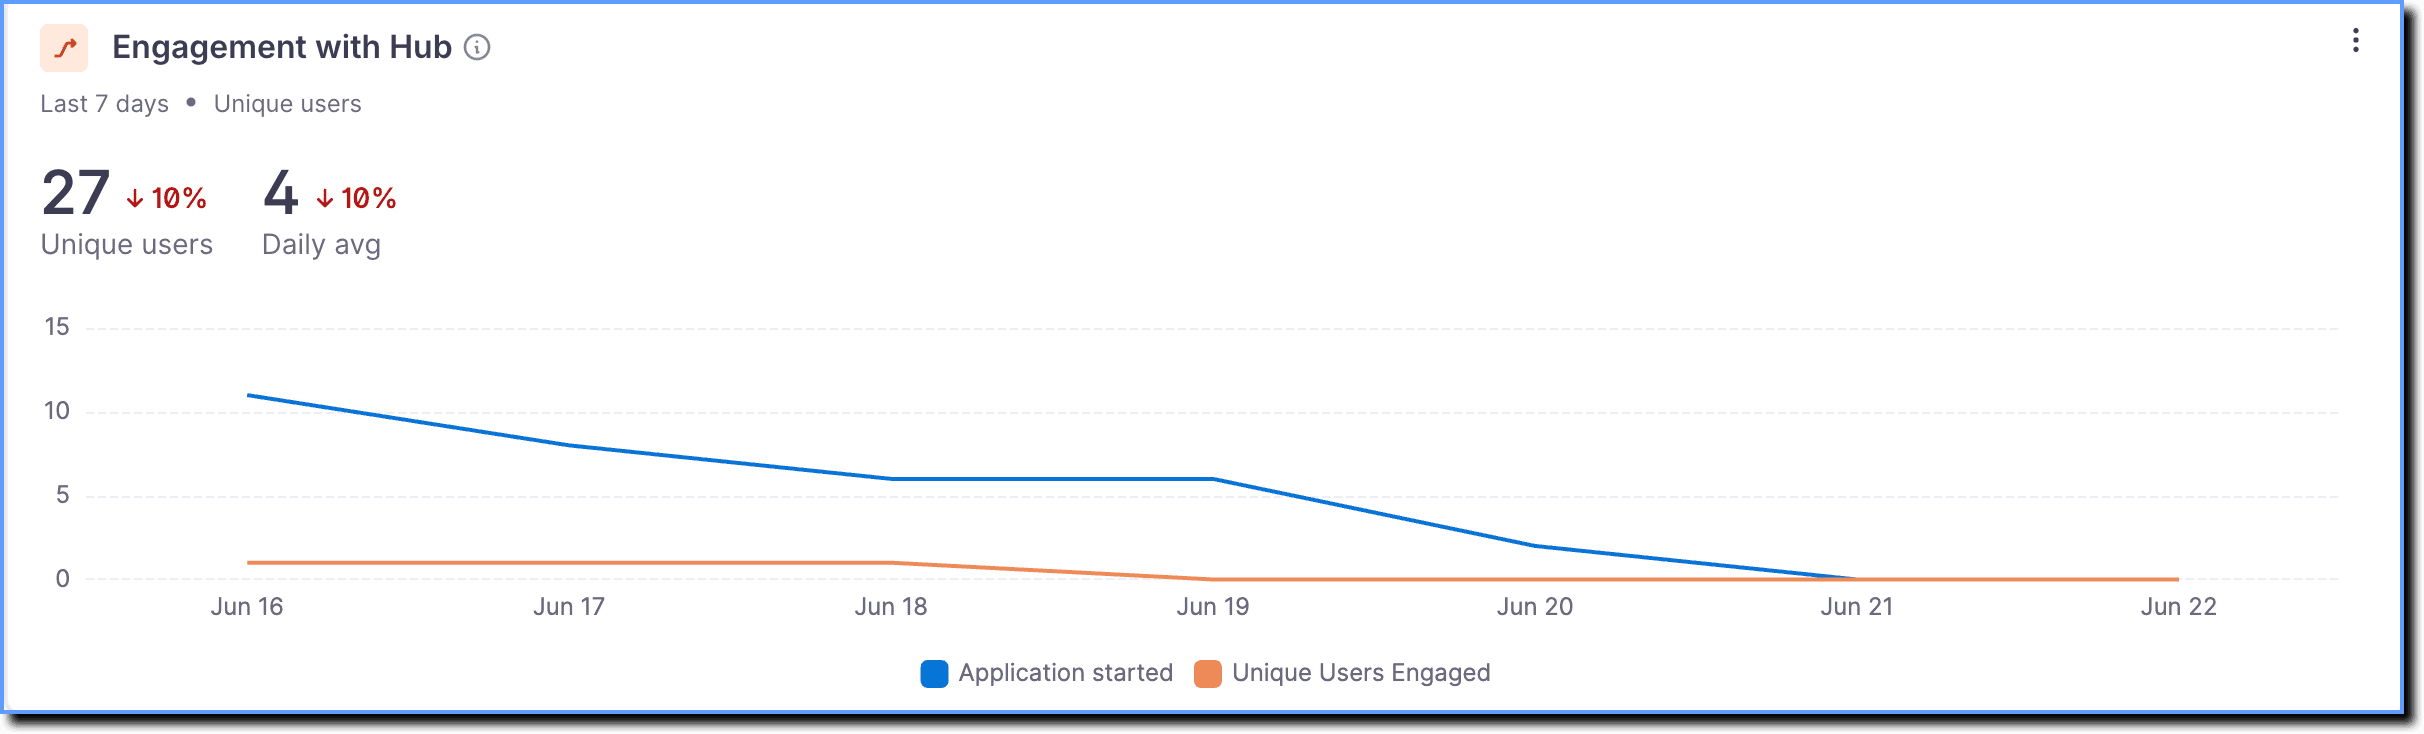
Additional analytics information
At the end of the page, see the following metrics:
| Most popular content | Displays content that is actively used by the end users |
|---|---|
| Most active users | Displays most active end users on DAP on OS. |
| User distribution by top countries | Displays end users based on countries |
| User distribution by top regions | Displays end users based on regions |