Attributes
Add User Attributes in Trend Insights
Once you capture User Attributes, such as role, department, or email ID, Whatfix enables you to filter your users based on these parameters to understand their behavior.
Use cases
Consider that you observe that a certain group of users is making errors while creating an account. Capture their characteristics, such as Role or Department, as User Attributes and visualize them in Trend Insights to understand which group of users needs your guidance.
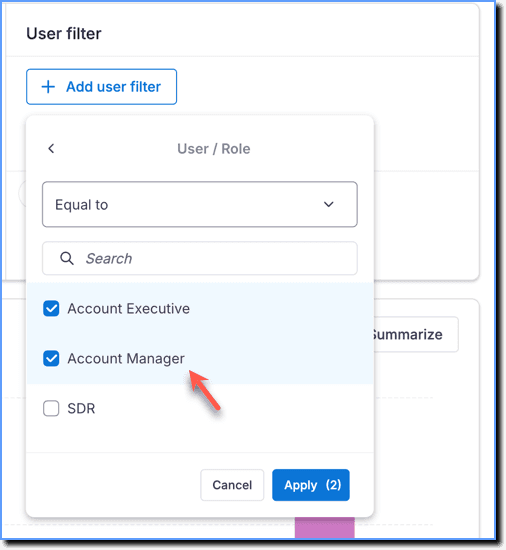
Event metric: Total events App events: Account Create Error User filter: Role = Account Executive, Account Manager User breakdown: Role 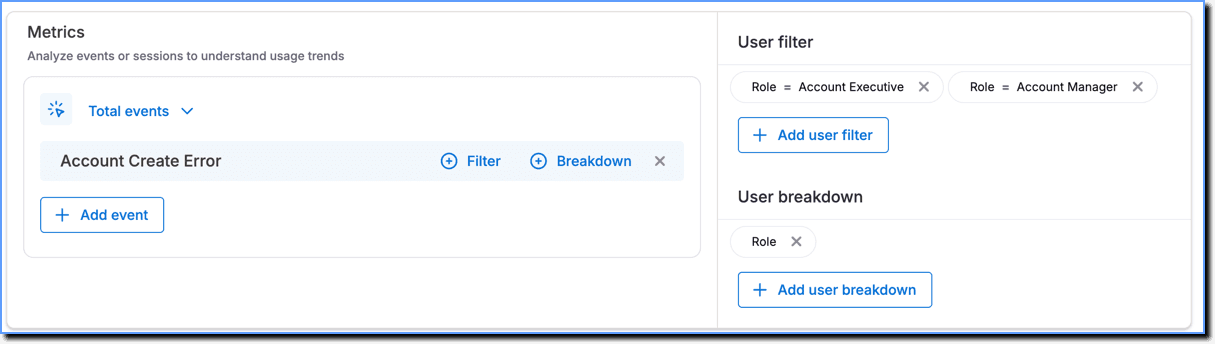
Chart: 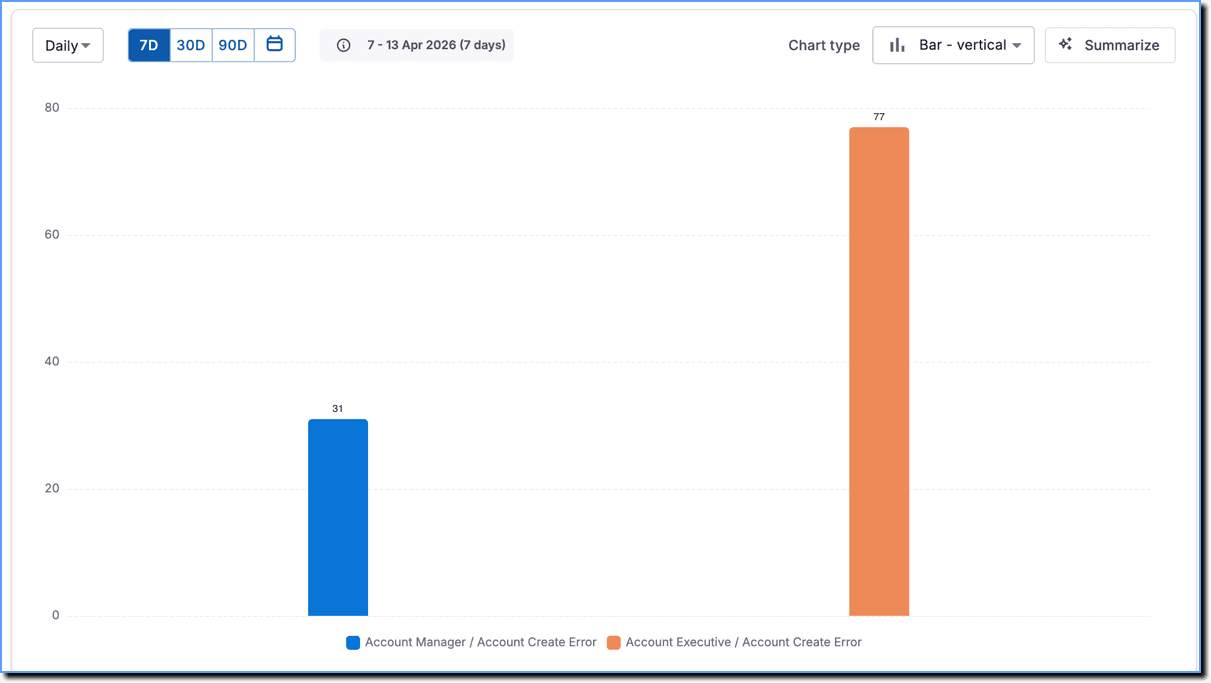
Consider that you want to track the total time the Sales department has spent in the application during the past month.
Session metric: Total session time User filter: Department = Sales User breakdown: User Id

Visualized data: 
Expand the following accordions for more details:
Filter users who engaged with Whatfix content or the application based on User Attributes
Use the following steps to filter users who engaged with Whatfix content or the application based on User Attributes in Trend Insights:
-
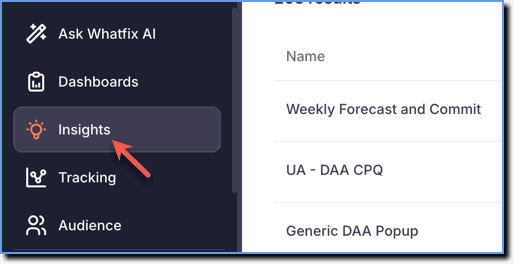
On the Whatfix Analytics dashboard, click Insights.
-
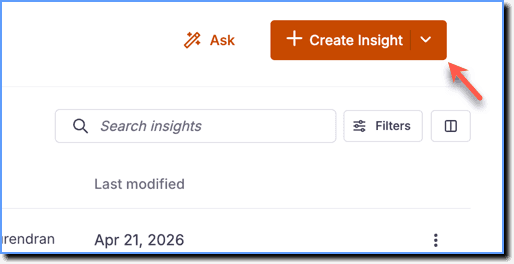
Click Create Insight.
-
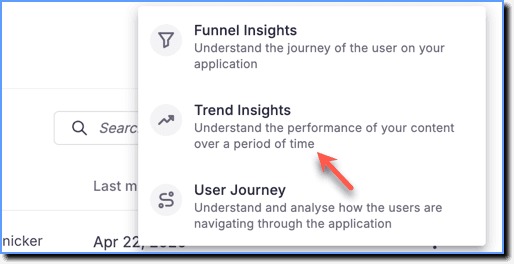
Click Trend Insights.
-
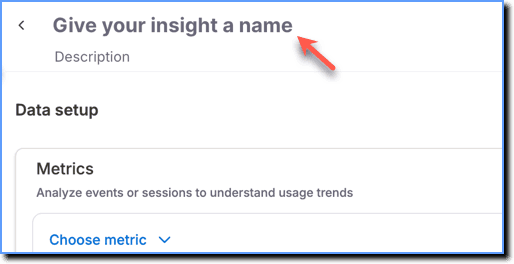
Click the Give your insight a name textbox and enter a name for your Insight.
-
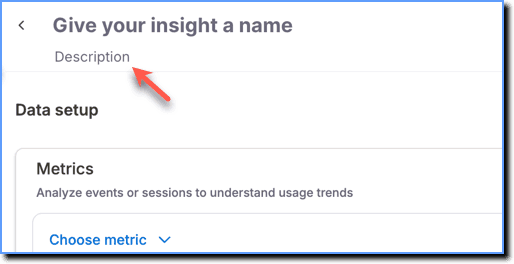
Click the Description text box and enter a description that explains what the Trend Insight is about.
-
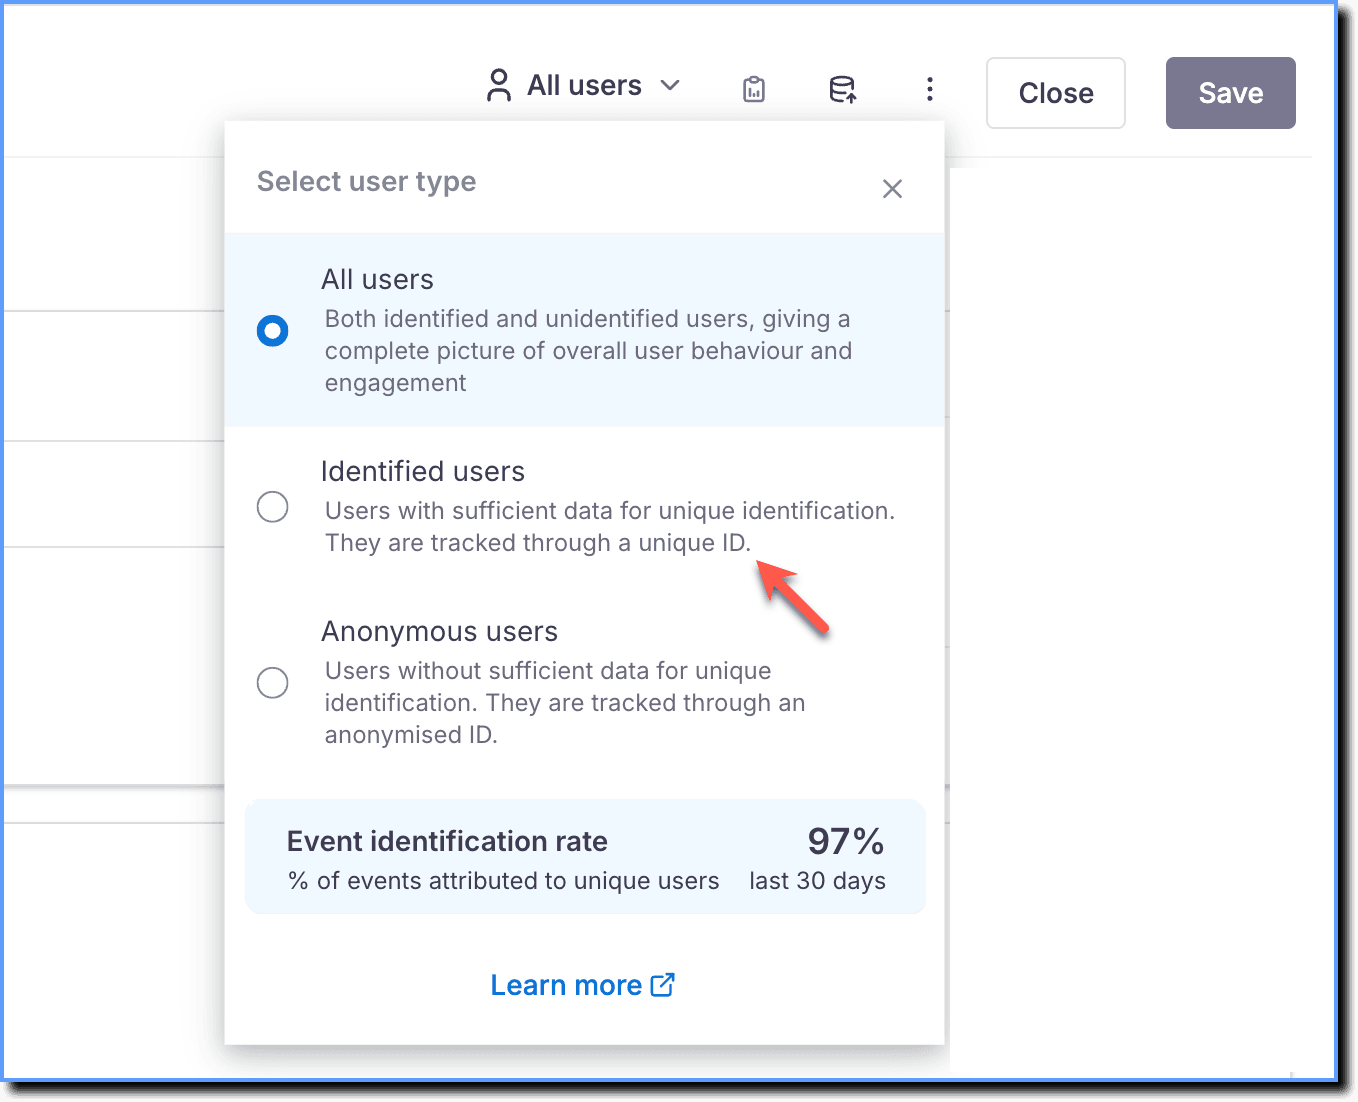
From the Select user type dropdown, choose whether to analyze data for All users, Identified users, or Anonymous users.
Note:
- By default, Insights data might contain identified (users identified by User ID) and unidentified (users not identified but denoted by Anonymized Whatfix IDs) users.
- The Event identification rate indicates the percentage of events Whatfix is able to attribute to uniquely identified users.
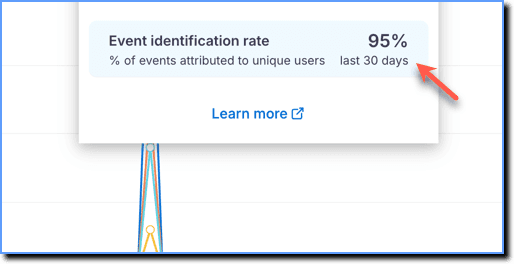
- For more information on filtering users and understanding the Event identification rate, see How can I filter unidentified users in Insights?
- Click the Data source icon and select the stage from which you want to get the data.
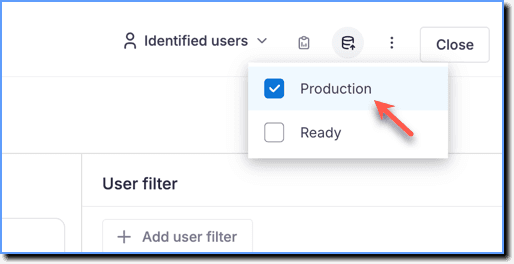
- For more information on obtaining analytics data from different stages, see Get Analytics Data across CLM Stages.
- The stage cannot change after creating the Insight. Switching to a different stage resets the Insight, requiring a restart.
- Click Choose metric.
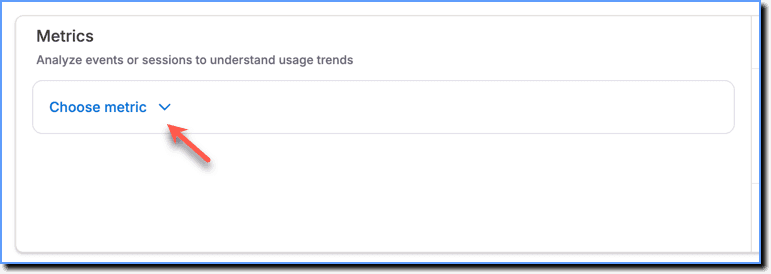
- Under Event metrics, select Total events or Unique users as required.
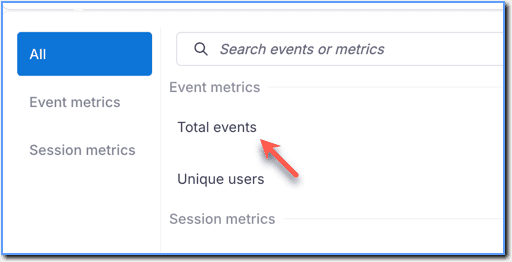
- Click Add event and then add the required Guidance events, App events, or Event groups.
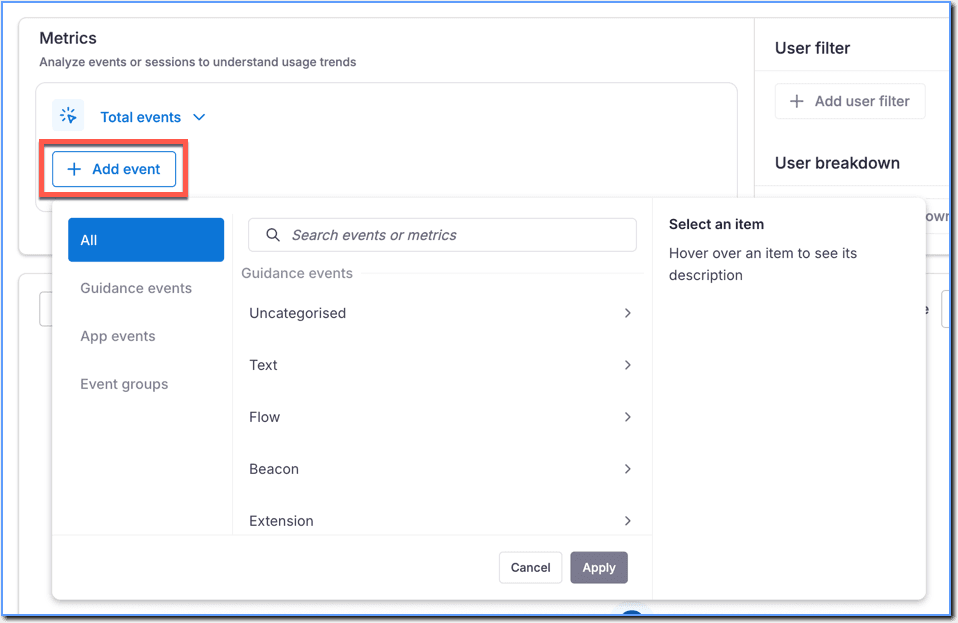
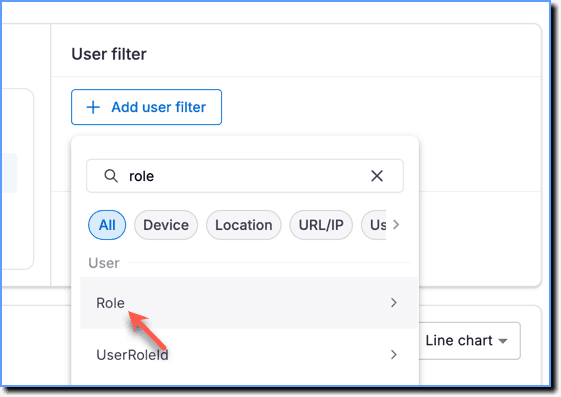
- In the User filter section, click Add user filter and select the desired User Attribute. In this example, Role is the captured User Attribute.
- Select the values captured for the User Attribute to filter your users, and then click Apply.
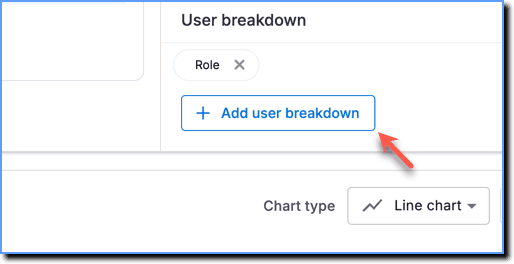
- In the User breakdown section, click Add user breakdown to group users by their Role, Team, Department, and more.
- Scroll down to view the generated data chart.
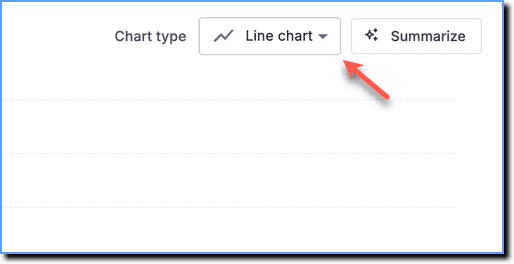
- Visualize the data using different chart types.
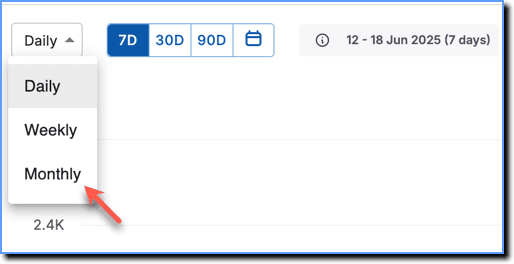
- Filter data based on Daily, Weekly, and Monthly timeframes.
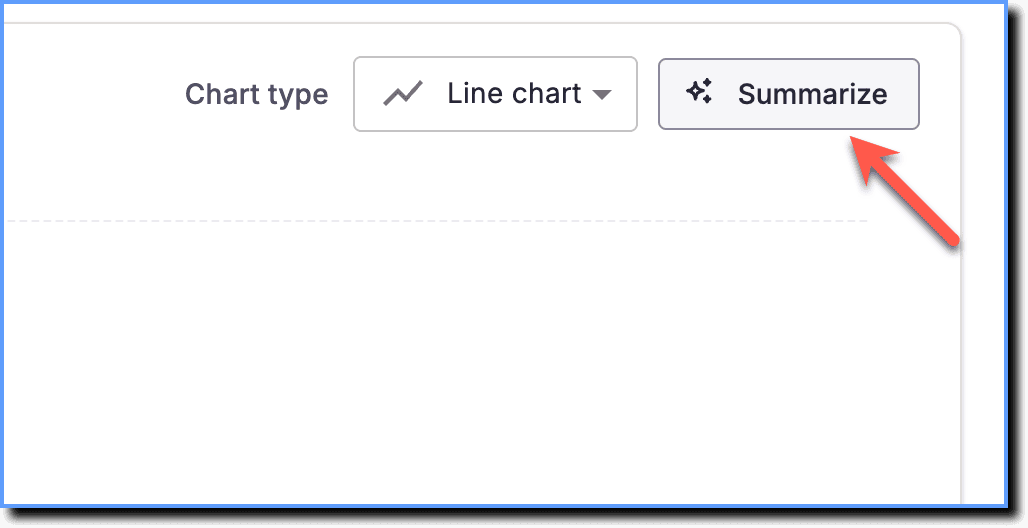
- Click Summarize to generate an AI summary of the Trend Insight. This helps you interpret the data more easily and understand key patterns. You need to enable Ask Whatfix AI to get the AI summary.
- Click Save.
Filter session data based on User Attributes
Use the following steps to filter session data based on User Attributes in Trend Insights:
-
On the Whatfix Analytics dashboard, click Insights.
-
Click Create Insight.
-
Click Trend Insights.
-
Click the Give your insight a name textbox and enter a name for your Insight.
-
Click the Description text box and enter a description that explains what the Trend Insight is about.
-
From the Select user type dropdown, choose whether to analyze data for All users, Identified users, or Anonymous users.
Note:
- By default, Insights data might contain identified (users identified by User ID) and unidentified (users not identified but denoted by Anonymized Whatfix IDs) users.
- The Event identification rate indicates the percentage of events Whatfix is able to attribute to uniquely identified users.
- For more information on filtering users and understanding the Event identification rate, see How can I filter unidentified users in Insights?
- Click the Data source icon and select the stage from which you want to get the data.
- For more information on obtaining analytics data from different stages, see Get Analytics Data across CLM Stages.
- The stage cannot change after creating the Insight. Switching to a different stage resets the Insight, requiring a restart.
- Click Choose metric.
- Under Session metrics, select the desired Session metric. For more information, see Analyze sessions using Trend Insights.
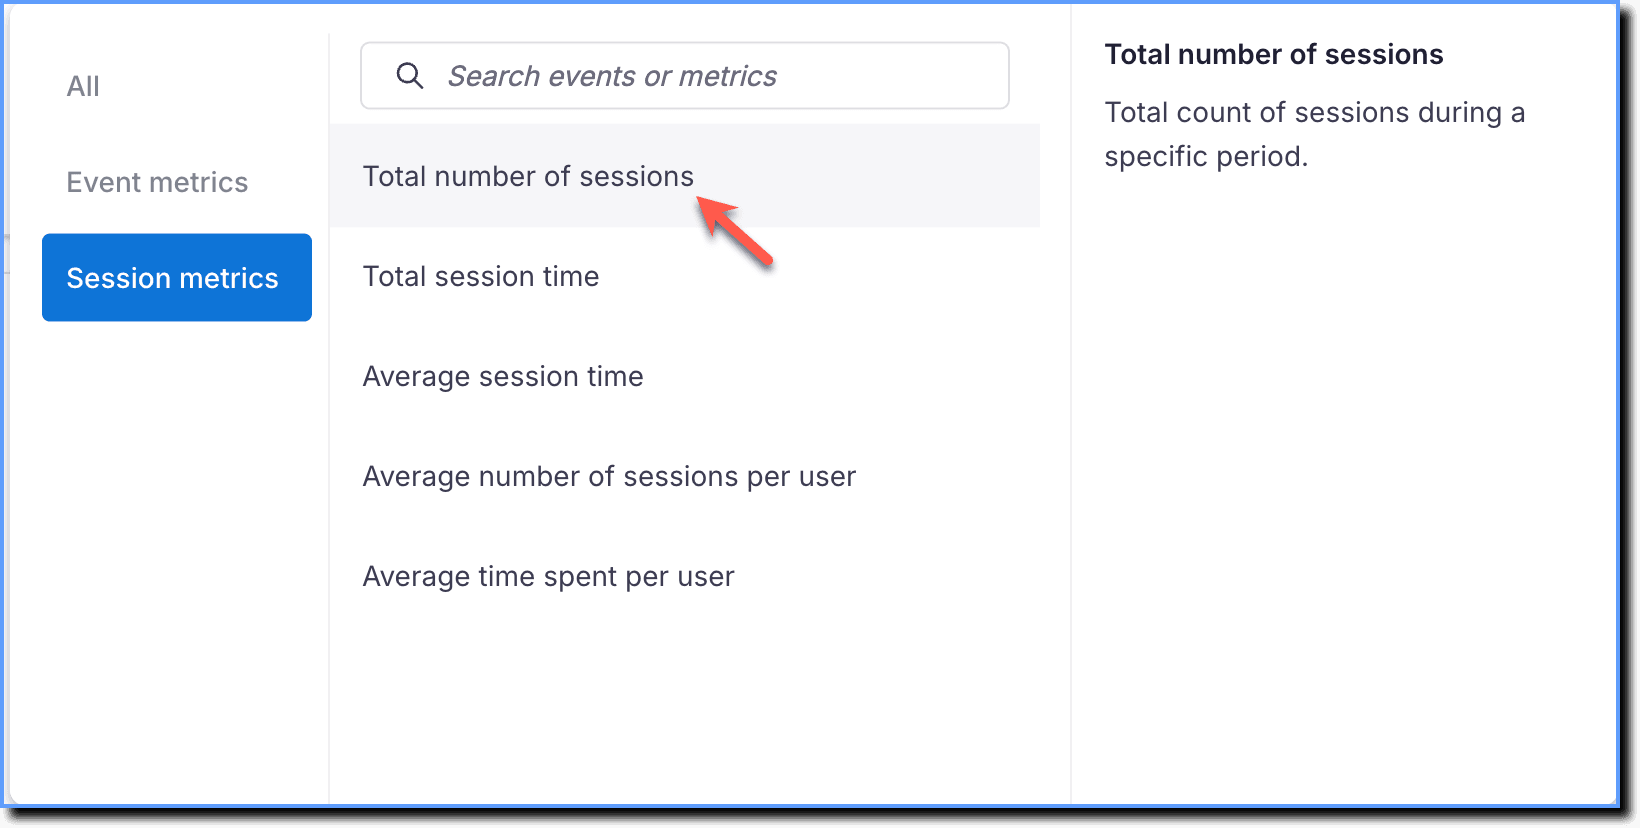
- Currently, session metrics don’t have any filters or breakdowns.
- The following image shows a session metric added:
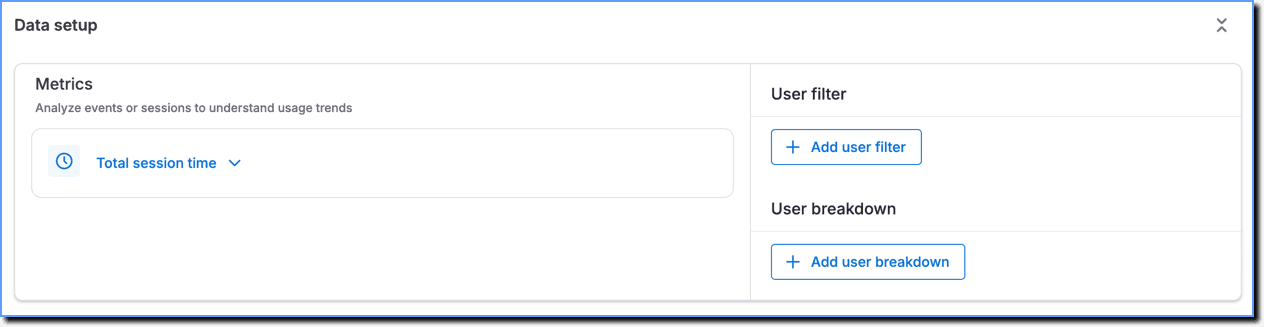
- Currently, Whatfix enables you to visualize only one session metric per Trend Insight.
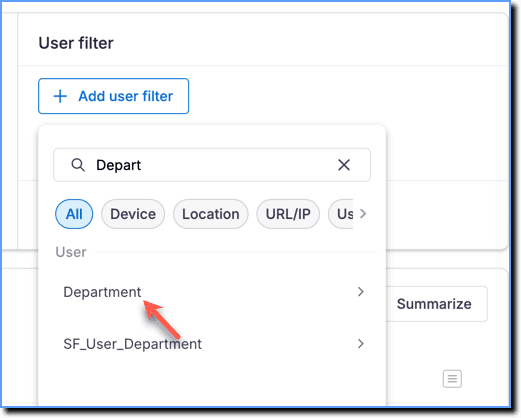
- In the User filter section, click Add user filter and select the desired User Attribute. In this example, Department is the captured User Attribute.
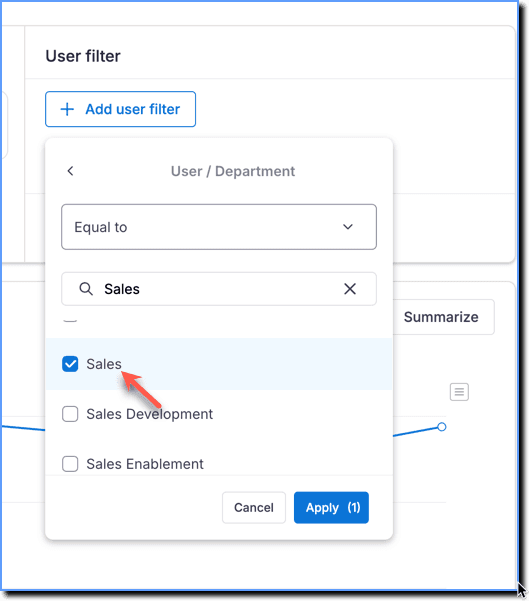
- Select the values captured for the User Attribute to filter your users, and then click Apply.
- In the User breakdown section, click Add user breakdown to group users by their Role, Team, Department, and more.
- Scroll down to view the generated data chart.
- Visualize the data using different chart types.
- Filter data based on Daily, Weekly, and Monthly timeframes.
- Click Summarize to generate an AI summary of the Trend Insight. This helps you interpret the data more easily and understand key patterns. You need to enable Ask Whatfix AI to get the AI summary.
- Click Save.
Shows overall behavior and engagement for both identified and anonymous (unidentified) users.
Users that Whatfix can detect and identify using a unique User ID.
Users that Whatfix cannot identify. These users are denoted by the Anonymized Whatfix IDs rather than an actual User ID.
The total number of times the event occurred.
The number of unique users who triggered the event.
Guidance events include all events triggered when end users interact with Whatfix content or widgets within the application.
App events include engagement with User Actions, Autocaptured events (Beta), or events captured using the Whatfix API.
An Event group combines two or more individual events into a single grouped-event. It enables you to see the total number of users who performed any of the events in the group.